research report template
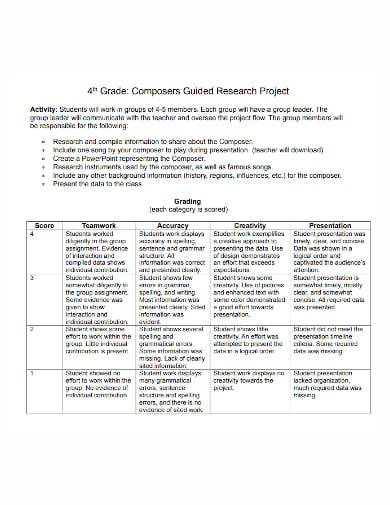
In today’s fast-paced world of academic and business research, the importance of effectively communicating findings cannot be overstated. A well-structured research report serves as the cornerstone of presenting complex data and analyses in a coherent manner, allowing audiences to grasp insights and implications with ease. At the heart of this endeavor lies the research report template—a powerful tool designed to streamline the writing process and enhance clarity. Whether you are embarking on a university project, conducting market research, or documenting a business study, a thoughtfully crafted template can guide you through the intricacies of reporting, ensuring that critical components like methodology, results, and conclusions are clearly articulated. This article delves into the essence of research report templates, exploring their utility, versatility, and the ways they can elevate your research communication to new heights.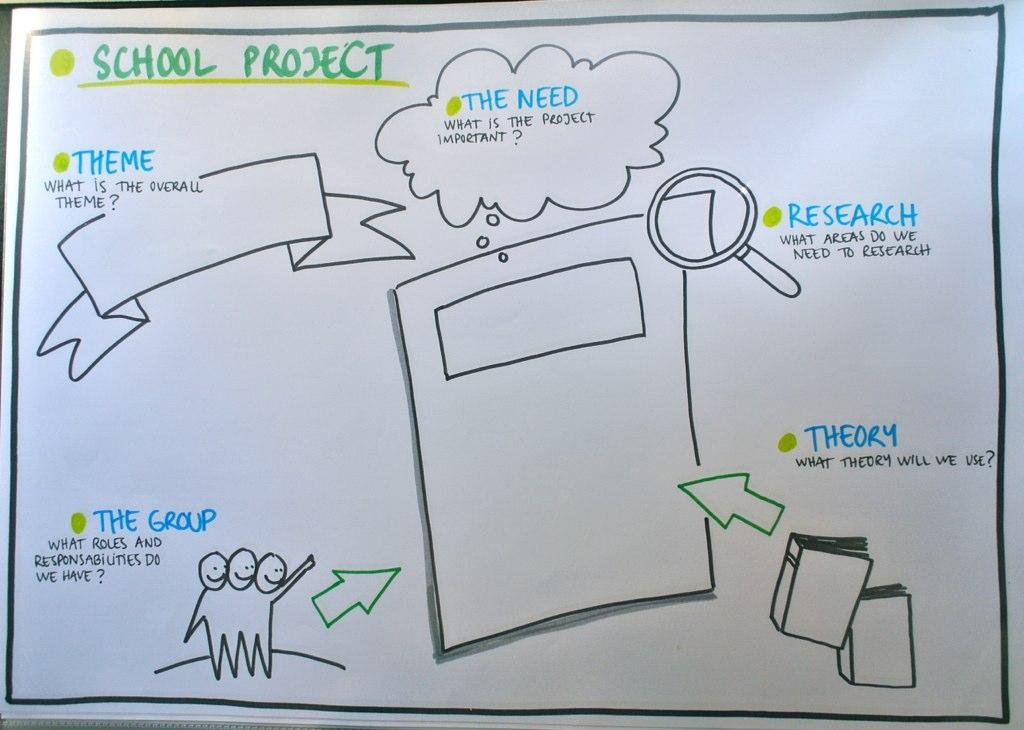
Understanding the Essential Elements of a Research Report Template
Creating a comprehensive research report template involves understanding its critical components that structure the research findings effectively. At its core, a solid template should include the following essential elements:
- Title Page: Clearly states the report’s title, author(s), and date of publication.
- Abstract: A brief summary encapsulating the key questions, methodology, results, and conclusions.
- Introduction: Provides background on the research topic, its significance, and research objectives.
- Methodology: Details the procedures and methods employed during the research, ensuring reproducibility.
- Results: Presents the findings, often accompanied by tables or graphs to enhance clarity.
- Discussion: Interprets the results, highlighting their implications and limitations.
- Conclusion: Summarizes the main insights and suggests future research directions.
- References: Lists all the sources cited in the report, adhering to a specific citation style.
Incorporating these elements in a standardized format not only elevates the professionalism of the report but also enhances its usability for readers. A well-structured template aids researchers in organizing their thoughts and findings consistently, making it easier for stakeholders to digest complex information. To illustrate, consider this basic layout for clarity:
| Section | Description |
|---|---|
| Title Page | Title, Author(s), Date |
| Abstract | Summary of the report |
| Introduction | Background and objectives |
| Methodology | Research approach and methods |
| Results | Findings presented visually |
| Discussion | Interpretation of findings |
| Conclusion | Main insights and future directions |
| References | Sources cited |

Crafting a Cohesive Structure for Clarity and Flow
When constructing a research report, a well-thought-out structure is essential for guiding readers through your findings and arguments. Begin with a clear outline that allows the natural flow of ideas. This outline should include key sections such as the introduction, methodology, results, discussion, and conclusion. Each segment must seamlessly transition into the next, employing connective phrases and logical progression to maintain reader engagement. As a helpful strategy, consider incorporating the following elements:
- Headings and Subheadings: Use descriptive titles to organize content effectively.
- Consistent Formatting: Apply uniform styles for fonts, colors, and bullet points.
- Visual Aids: Integrate graphs and charts to complement textual data.
Ensure that each section serves a specific purpose while contributing to the overall narrative of the report. For instance, the methodology should not only outline procedures but also justify their selection, enhancing credibility. To further enrich the cohesiveness, consider using a table to summarize key points within the report. Here’s a simple format:
| Section | Purpose |
|---|---|
| Introduction | Define the research question and significance. |
| Methodology | Explain the approach and techniques used. |
| Results | Present and summarize the findings. |
| Discussion | Interpret the findings and their implications. |
| Conclusion | Provide final thoughts and potential future research. |
By adhering to these guidelines, your report will not only convey information effectively but also engage your audience, ensuring they grasp your research’s essence and significance.
Enhancing Data Presentation with Visual Tools and Graphics
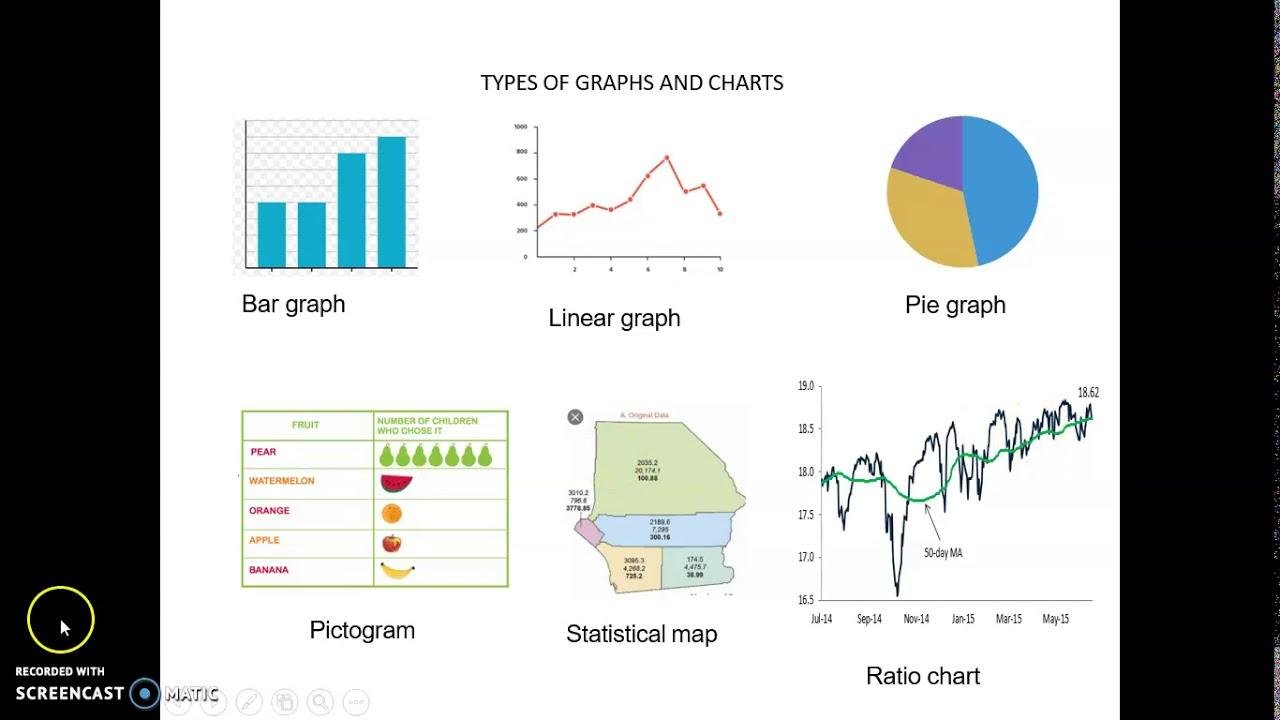
Visual tools and graphics play a pivotal role in transforming complex data into easily digestible formats. By leveraging infographics, charts, and diagrams, researchers can significantly enhance the comprehension and retention of critical information. Instead of merely reporting numbers, the use of compelling visuals allows audiences to grasp trends and patterns quickly, facilitating informed decision-making. Consider incorporating various types of graphics tailored to your content, such as:
- Bar graphs to compare data points across categories
- Pie charts to illustrate proportions and percentages
- Heat maps to represent data density
- Flowcharts to outline processes or workflows
Moreover, the effective use of colors and fonts in these visuals can engage the audience further. Utilizing a consistent color palette not only enhances aesthetic appeal but also reinforces branding throughout the report. Below is a simple example of a table that presents data in a structured format, making it readily accessible for readers:
| Feature | Description |
|---|---|
| Interactive Charts | Allow users to engage directly with the data |
| Dynamic Graphs | Show changes over time effectively |
| Customized Infographics | Tailored to specific audience needs and context |
Practical Tips for Tailoring Your Research Report to Different Audiences
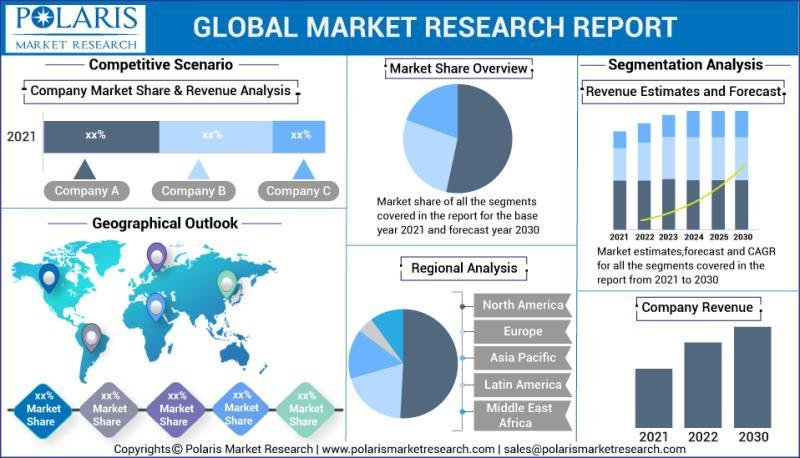
Understanding the unique needs of your audience is crucial when crafting a research report. Different stakeholders may have varying levels of familiarity with the subject matter, which can impact how you present your findings. For instance, when addressing academic peers, focus on methodological rigor and data analysis. However, if your audience includes industry professionals, emphasize practical implications and actionable insights. To bridge the gap, consider integrating visuals like charts and infographics that distill complex information into easily digestible formats. A few tips include:
- Highlight Key Findings: Summarize critical results in bullet points for clarity.
- Use Layman’s Terms: Avoid jargon when addressing a general audience.
- Incorporate Case Studies: Real-world examples can resonate well with practitioners.
Structuring your report to facilitate audience engagement is equally important. Tailor your introduction to align with the reader’s interests and expectations. For example, in a corporate setting, begin with a summary of business implications, while an academic audience may appreciate a more traditional literature review. Consider creating a simple table to contrast the focus areas for different consumer segments:
| Audience Type | Report Focus | Preferred Format |
|---|---|---|
| Academics | Methodology & Findings | Detailed Text & Data |
| Industry Professionals | Applications & Implications | Visuals & Case Studies |
| General Public | Overview & Impact | Infographics & Summaries |
Key Takeaways
a well-structured research report template serves as a valuable compass for navigating the often complex world of data presentation. Whether you’re embarking on a market analysis, evaluating policy impacts, or documenting findings from qualitative studies, a template can streamline your writing process, ensuring clarity and coherence. With a variety of options available online, such as those from Venngage, SAMPlates, and tools4dev, you can find the perfect template that suits your unique needs and boosts your research’s impact. Embrace these tools to convey your findings effectively, transforming raw data into insightful narratives that resonate with your audience. As you embark on your next research endeavor, remember: the right template not only saves time but also enhances the quality of your work, paving the way for informed decisions and meaningful discussions.


