research report sample

Introduction to Research Report Samples
In the realm of academia and professional research, the ability to present findings in a clear, structured manner is paramount. A research report serves as a critical medium through which researchers communicate their inquiries, methodologies, and discoveries to both peers and the public. With its meticulously organized format, the research report not only delineates the steps taken during the research process but also encapsulates the insights gleaned from the study. This article explores various research report samples, showcasing how different formats cater to diverse research methodologies, including quantitative and qualitative approaches. By examining these examples, readers will gain a comprehensive understanding of the essential components that comprise an effective research report, ensuring clarity and accuracy in scientific communication. Whether you are a seasoned researcher or a novice embarking on your first project, these samples will provide invaluable guidance in crafting your own impactful research reports.
Understanding the Structure of an Effective Research Report
To create a compelling research report, it’s essential to adhere to a structured format that facilitates clear communication. Typically, such reports encompass several key sections: Introduction, Methodology, Results, and Discussion. Each section plays a pivotal role in conveying the research narrative. The Introduction sets the stage by outlining the research question and its significance, while the Methodology details the processes and techniques employed to gather data. In the Results section, researchers present their findings, often supported by graphs or tables that make complex data accessible. the Discussion interprets these results, linking them back to the original hypotheses and the broader context of existing literature.
Moreover, an effective research report integrates clarity and precision in its presentation. Key attributes include:
- Focus: Every section should direct attention to critical insights, avoiding unnecessary jargon or convoluted arguments.
- Accuracy: Data must be correctly interpreted and devoid of misleading representations, ensuring that the reader can trust the conclusions drawn.
- Organization: A logical flow between sections enhances readability, allowing the audience to follow the research trajectory seamlessly.
To illustrate the importance of structure, consider the following table that summarizes the main components of a research report along with their purposes:
| Section | Purpose |
|---|---|
| Introduction | Present the research question and context. |
| Methodology | Describe how the research was conducted. |
| Results | Show findings through data and analysis. |
| Discussion | Interpret results and relate to broader implications. |

Key Elements to Include for Clarity and Impact
html
To ensure your research report resonates with readers, clarity and impact should be prioritized through strategic organization and focused content. Begin by defining your purpose clearly. Articulate what your research aims to convey and structure your findings in a logical manner, guiding the reader through each key point. Include a summary table that highlights critical data or findings, making it easier for readers to grasp essential information at a glance.

Additionally, the use of visual aids such as charts and graphs is crucial for enhancing understanding. These elements can effectively illustrate trends and comparisons that verbal descriptions alone may struggle to convey. Furthermore, it is imperative to use concise language that avoids jargon, ensuring your report is accessible to a wider audience. Supporting your narrative with bullet points helps break down complex ideas into digestible segments, which can significantly improve reader retention.


      Element
      Description


      Purpose Statement
      Clearly defines the research aim and scope.


      Summary Table
      Highlights key findings succinctly.


      Visual Aids
      Utilizes graphs/charts for better comprehension.


      Concise Language
      Avoids jargon to enhance accessibility.


      Bullet Points
      Breaks down complex ideas for clarity.

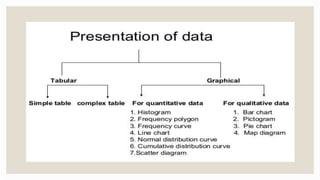
Analyzing Data Presentation Techniques for Enhanced Comprehension
To enhance the understanding of data presentation, it is crucial to employ a variety of techniques that cater to diverse learning styles and preferences. Visual aids like graphs, charts, and infographics can transform raw data into more digestible pieces of information. Consider the following effective techniques:
- Storytelling with data: Narratives can contextualize numbers, making them more relatable and memorable.
- Interactive Elements: Engaging your audience through quizzes or real-time polls can foster an active learning environment.
- Consistent Formatting: Providing a uniform layout helps reduce cognitive load, allowing viewers to focus more on the information presented.
Furthermore, organizing data in tables can clarify comparisons and highlight key insights. Here is a simple table layout emphasizing different data presentation formats:
| Format | Advantages |
|---|---|
| Bar Graphs | Easy comparison of quantities. |
| Pie Charts | Visual representation of proportions. |
| Infographics | Engaging and informative summaries. |
By utilizing these techniques, presenters can substantially improve comprehension, ensuring that their audience not only understands the data but also retains the information effectively.

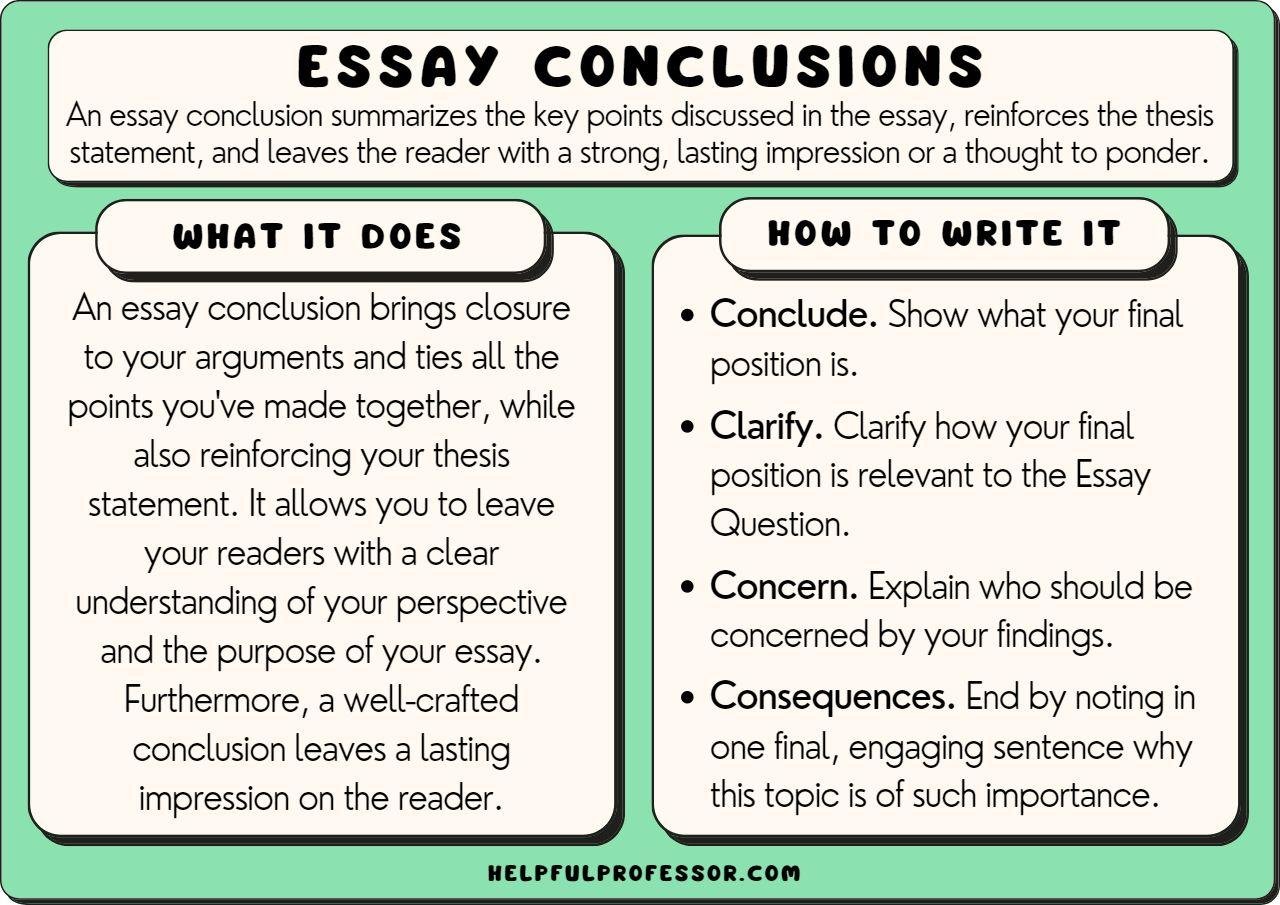
Best Practices for Crafting Clear and Actionable Conclusions
Conclusions serve as the final impression of your research report, so crafting them with clarity and purpose is essential. To achieve this, focus on summarizing the key findings effectively. Highlight the most significant results and correlate them with your initial research objectives. Utilize bullet points to encapsulate the critical elements that you want to emphasize:
- Reiterate major findings.
- Connect findings back to research questions.
- Identify implications of the results.
- Simplify complex data into digestible insights.
Furthermore, it’s crucial that your conclusions prompt the reader to take further action or consider future directions. Incorporate specific recommendations that are built upon your findings, ensuring they are realistic and actionable. To illustrate your recommendations effectively, consider utilizing a table format, as shown below:
| Recommendation | Expected Outcome |
|---|---|
| Implement regular training sessions | Improved employee productivity |
| Increase funding for research initiatives | Enhanced innovation capabilities |
| Conduct quarterly reviews of policies | Greater compliance and effectiveness |
In Summary
In concluding our exploration of research report samples, it’s clear that these documents play a vital role in communicating findings across various disciplines. Whether you’re diving into the intricacies of scientific research or examining the nuances of social studies, effective research reporting hinges on clarity, focus, and accuracy. By embracing the structure and principles outlined in the examples we’ve discussed, aspiring researchers can craft their own reports that not only present their findings convincingly but also engage their readers meaningfully. As you embark on your journey of writing, remember that a well-structured report is a bridge between your ideas and the world’s understanding, paving the way for future inquiry and discovery. Embrace the challenge, harness the examples, and let your research shine.


