research report format sample

In the realm of academic inquiry and professional analysis, the research report stands as a cornerstone of effective communication. It serves not just as a vessel for data, but as a structured narrative that distills complex information into digestible insights. Crafting a research report involves meticulous attention to detail and adherence to specific formatting guidelines, which can vary widely depending on the field of study and the intended audience. This article aims to provide a comprehensive introduction to the various formats of research reports, offering samples and guidelines that highlight the essential components of these documents. By understanding the foundational elements and diverse structures of research reports, readers will be better equipped to present their findings in a clear and impactful manner, ensuring that their conclusions resonate with stakeholders and contribute to the body of knowledge in their respective fields. Whether you are a novice researcher or a seasoned analyst, appreciating the nuances of research report formats can elevate your work and enhance its accessibility and relevance in an increasingly data-driven world.
Understanding the Essential Components of a Research Report Format
A well-structured research report is crucial to effectively communicate your findings and insights. The format typically includes several key components that work together to present your work clearly and logically. Essential components include the title page, abstract, introduction, literature review, methodology, results, discussion, conclusion, and references. Each of these elements plays a distinct role in guiding the reader through the complexities of your research. For instance, the abstract provides a succinct summary, while the introduction sets the stage for the problem being addressed and the research objectives.
To ensure coherence and flow throughout your report, it’s essential to adhere to a consistent structure. You may consider the following elements in your layout:
- Title Page: Contains the report title, your name, and institutional affiliation.
- Abstract: Brief overview of the study’s purpose, methods, results, and conclusions.
- Introduction: Introduction of the research problem and objectives.
- Methodology: Detailed explanation of how the research was conducted.
- Results: Presentation of the findings.
- Discussion: Interpretation of the results and their implications.
- Conclusion: Summary of findings and recommendations.

Crafting Clear and Concise Abstracts to Engage Readers
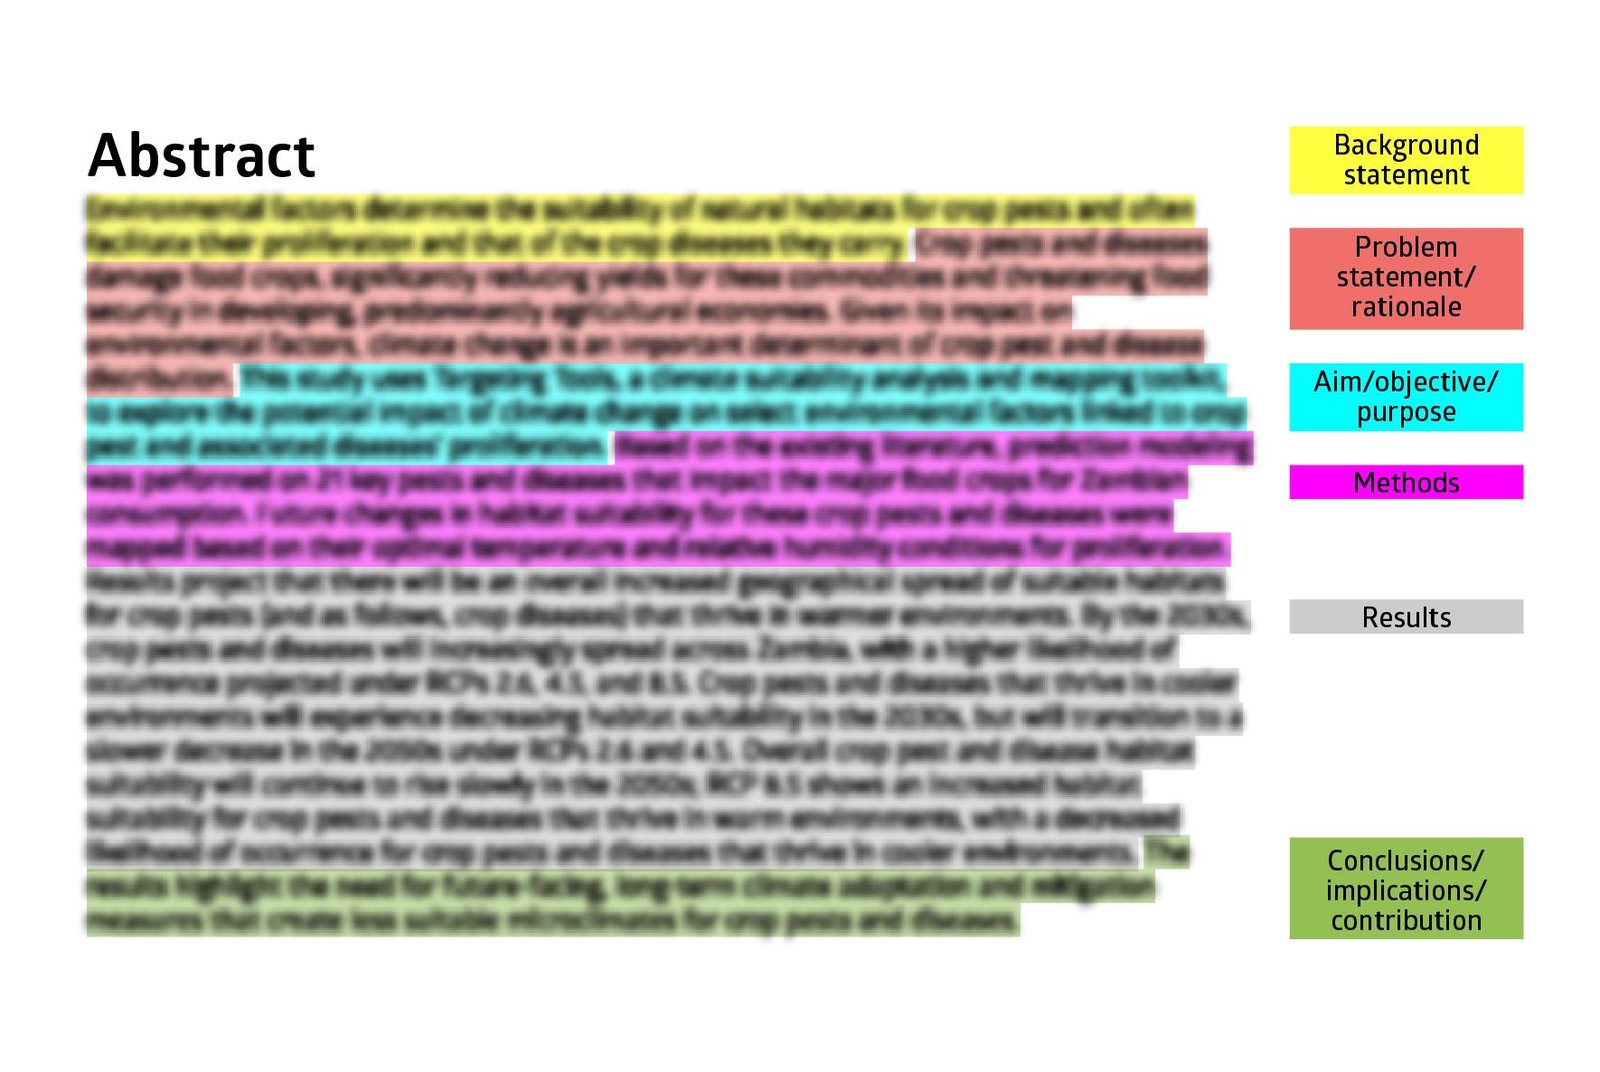
When writing an abstract, clarity and conciseness are vital to capture your audience’s attention. A well-crafted abstract should offer a snapshot of your research, allowing readers to quickly understand the study’s purpose, methodology, results, and implications. To achieve this, consider breaking your abstract into distinct sections: Purpose, Methods, Results, and Conclusions. Each segment should contain one or two sentences that directly answer essential questions about your research. For example:
- Purpose: What was the main question your research aimed to answer?
- Methods: What techniques or approaches did you use to investigate this question?
- Results: What key findings emerged from your research?
- Conclusions: What are the broader implications of your findings?
In practice, an effective abstract not only informs but also engages the reader’s curiosity. Avoid jargon and overly complex sentences, as these can detract from the clarity of your message. Instead, aim for simplicity and directness. For example, utilize active voice and specific language, as well as limit your abstract to around 150-250 words. This keeps your writing focused, while also ensuring that every word adds value. Here’s a simple table outlining key components:
| Component | Description |
|---|---|
| Purpose | Clearly states the research question |
| Methods | Details the research approach |
| Results | Summarizes main findings |
| Conclusions | Highlights significance and implications |

Structuring Your Findings: Best Practices for Clarity and Impact
When presenting your findings, employing a logical structure is vital for maximizing clarity and impact. Start by clearly defining key terms and concepts to avoid ambiguities. Organize your data into thematic sections, allowing the reader to easily navigate through the report. Consider using headings and subheadings effectively to break down complex information. A well-structured outline may include:
- Introduction of Findings: Briefly summarize the main findings.
- Data Presentation: Use charts or graphs to convey data visually.
- Detailed Analyses: Discuss the implications of the findings.
- Conclusions and Recommendations: Provide actionable insights based on the data.
Incorporating visual aids such as tables can enhance understanding by providing quick references to critical information. For instance, a summary table can effectively compare various data sets or illustrate trends over time. Ensure that each visual aid is accompanied by a short description to guide the reader’s interpretation. Here’s an example of a simple table structure:
| Finding | Data Point | Implication |
|---|---|---|
| Increased Engagement | 70% | Improved retention rates |
| Higher Satisfaction | 85% | Positive feedback from users |

Enhancing Presentation: Tips for Effective Visuals and Tables
To create impactful visuals in your research report, it’s essential to prioritize clarity and relevance. Start by choosing a consistent color palette and font style that reflects the theme of your research. Use high-quality images and diagrams that can effectively illustrate your points, ensuring that they are easily comprehensible and well-labeled. Consider the following tips for creating effective visuals:
- Limit the amount of text on slides or visuals to enhance focus.
- Incorporate graphs or charts to present data in a digestible format.
- Utilize white space to avoid clutter and improve readability.
When using tables to present complex data, structure is vital. Ensure each table has a clear title and includes concise headings that help the reader understand the data at a glance. Here’s an example of a simple data table that effectively demonstrates survey results:
| Criterion | Response Rate (%) |
|---|---|
| Clarity of Content | 85 |
| Visual Appeal | 90 |
| Usefulness of Information | 88 |
Ensure that your audience can extract insights easily from tables by keeping them straightforward and pointing out significant trends or metrics within the text. Engaging presentations are a blend of compelling visuals and clear data, allowing your findings to shine through.
The Conclusion
understanding the format of a research report is essential for anyone looking to effectively communicate their findings. Whether you are presenting data from a scientific study, an engineering project, or a psychological investigation, adhering to a structured format not only enhances clarity but also aids in conveying the significance of your research. By employing the sample formats discussed, you can ensure that your report is both comprehensive and accessible, allowing your audience to grasp the key elements of your work. Remember, a well-crafted research report is not just a collection of data; it’s a narrative that tells the story of your inquiry and the insights you have uncovered. As you embark on your writing journey, let these principles guide you, and watch as your research comes to life on the page.


