research report example format

In an age where data-driven decision making reigns supreme, the importance of clear and effective research reporting cannot be overstated. Whether you’re a budding researcher, a seasoned academic, or a business professional, navigating the realm of research reports can often prove daunting. With a myriad of styles, structures, and guidelines to consider, how does one distill complex findings into a format that is both engaging and informative? This article delves into the essential elements of a research report example format, offering a comprehensive guide tailored to demystify the process. From the foundational components of an effective introduction to the meticulous details of data presentation, we will explore how to craft a report that not only communicates your findings but also captivates your audience. Join us as we break down the critical frameworks that transform raw data into compelling narratives, paving the way for insightful conclusions and impactful decisions.
Understanding the Structure of a Research Report
Research reports follow a structured format that enhances the clarity and flow of information presented. Typically, these reports include several key components, each serving a distinct purpose. Understanding these sections is paramount for both the writer and the reader, as they help navigate the complex world of research findings. The main sections usually consist of:
- Abstract: A brief summary highlighting the main objectives and findings.
- Introduction: An overview of the research problem and its significance.
- Literature Review: A discussion of existing studies relevant to the research topic.
- Methodology: A detailed explanation of the research design, data collection, and analysis methods.
- Results: Presentation of the research findings, often with tables and graphs.
- Discussion: Interpretation of the results and their implications.
- Conclusion: Summary of the main points and potential future research directions.
- References: A list of sources cited throughout the report.
Within each section, the organization and presentation can vary depending on the discipline and the preferences of the researchers involved. For clarity, here is a simple breakdown of an exemplary research report format:
| Section | Description |
|---|---|
| Abstract | A concise summary of the research. |
| Introduction | Introduces the research topic and its importance. |
| Methodology | Details the research design and methods. |
| Results | Summarizes the findings with supporting data. |
| Discussion | Explores the implications of the findings. |
| References | Lists all cited works in the report. |

Key Components that Enhance Clarity and Impact
Crafting an effective research report requires attention to several vital components that significantly contribute to its clarity and impact. Structure plays a pivotal role; a well-organized layout enables readers to navigate easily through the information presented. Consider incorporating the following elements to streamline your report:
- Abstract: A succinct summary encapsulating the study’s objectives and findings.
- Introduction: A clear exposition of the research question and its relevance.
- Methodology: An in-depth explanation of the research design and techniques used.
- Results: A straightforward presentation of data, illustrated with tables or graphs for visual impact.
- Discussion: An interpretation of the results, highlighting their implications.
- Conclusion: A concise summary reinforcing the study’s significance and potential future research.
Another essential aspect is the visual presentation of your report. Utilizing appropriate graphics can greatly enhance understanding and retention. Tables and charts serve to break up text-heavy sections, making intricate data more digestible. For example, you might present key findings in a cleanly styled table as follows:
| Finding | Value | Significance |
|---|---|---|
| Sample Size | 150 | Ensures reliability |
| Confidence Level | 95% | High certainty |
| Key Insight | 75% of participants | Common trend observed |

Best Practices for Writing Engaging Research Summaries
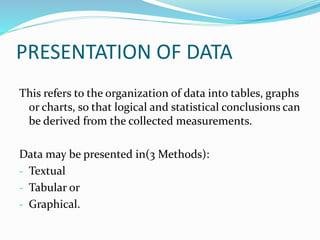
Creating research summaries that captivate your audience involves a delicate balance of clarity and engagement. To achieve this, consider highlighting key findings clearly and succinctly. Use bullet points to break down complex information into easily digestible pieces. By presenting your data visually, you can better capture attention and convey your message effectively. Include tables or charts where appropriate, ensuring that they are not overly complex. Each visual element should enhance understanding rather than distract from it.
Additionally, the language you choose is crucial. Aim for a tone that is both informative and accessible, avoiding jargon unless it’s widely understood in your field. Incorporating storytelling techniques can also make your summaries more relatable; presenting statistics within the context of real-world implications can spark curiosity. Incorporate questions that provoke thought or invite discussion at the end of your summary. Remember, the goal is not just to inform but to engage and inspire your readers to explore your research further.

Tips for Presenting Data and Analysis Effectively
To ensure that your data and analysis resonate with your audience, it’s essential to utilize engaging visuals and clear storytelling techniques. Start by selecting the right format for your data, whether it be graphs, charts, or infographics. Each visual element should enhance understanding, so choose colors and designs that are not only appealing but also easy to interpret. Additionally, consider your audience’s perspective—tailor your presentation to their level of expertise and interests. Using bullet points to highlight key takeaways can help reinforce the main ideas without overwhelming viewers with excessive details.
Moreover, clarity is crucial when presenting complex data. Break down information into digestible sections and introduce each component logically. A well-structured narrative aids in maintaining engagement and facilitating comprehension. For instance, a simple
| Data Type | Best Method |
|---|---|
| Trends | Line Graph |
| Comparisons | Bar Chart |
| Proportions | Pie Chart |
| Hierarchies | Tree Diagram |
can serve as a quick reference. This approach not only organizes information systematically but also allows your audience to visualize the relationships between different data points, fostering a deeper understanding of the analysis presented.
The Way Forward
crafting a research report is both an art and a science, requiring a precise balance of structure and creativity. By adhering to a clear format, researchers can effectively communicate their findings and insights, ensuring they resonate with their intended audience. Whether you are a seasoned scholar or just embarking on your research journey, understanding the example formats available can significantly enhance the clarity and impact of your work. As you embark on your own research endeavors, remember that a well-organized report not only conveys information but also paints a narrative that engages readers, inviting them to explore the depths of your discoveries. So, take these guidelines to heart, and let your research shine!


