research report design

Introduction to Research Report Design
In the realm of academic inquiry and data exploration, the design of a research report serves as the vital blueprint that guides the presentation of findings and insights. Much like an architect meticulously plans the structure of a building, researchers must thoughtfully craft their reports to effectively communicate their discoveries. A well-designed research report not only captures the essence of the research undertaken but also enhances the reader’s understanding through clarity and coherence.
This article delves into the fundamental aspects of research report design, highlighting essential components such as focus, accuracy, and organization. With a balanced approach, we aim to equip both novice and experienced researchers with the knowledge needed to create compelling reports that resonate with their audience, whether in academic settings or practical applications. By understanding the mechanics behind effective report design, researchers can elevate their work from mere data collection to impactful storytelling that drives knowledge forward.
Understanding the Fundamentals of Research Report Design
At the core of an effective research report lies the design that guides the reader through complex information seamlessly. A well-structured report enables the audience to absorb key findings and insights without navigating through dense text. Essential elements to consider include:
- Clarity: Ensure that every section serves a purpose and presents information clearly.
- Hierarchy: Use headings and subheadings to create a logical flow, guiding the reader through the narrative.
- Visual Elements: Integrate charts, graphs, and tables to illustrate data succinctly, breaking up text-heavy sections.
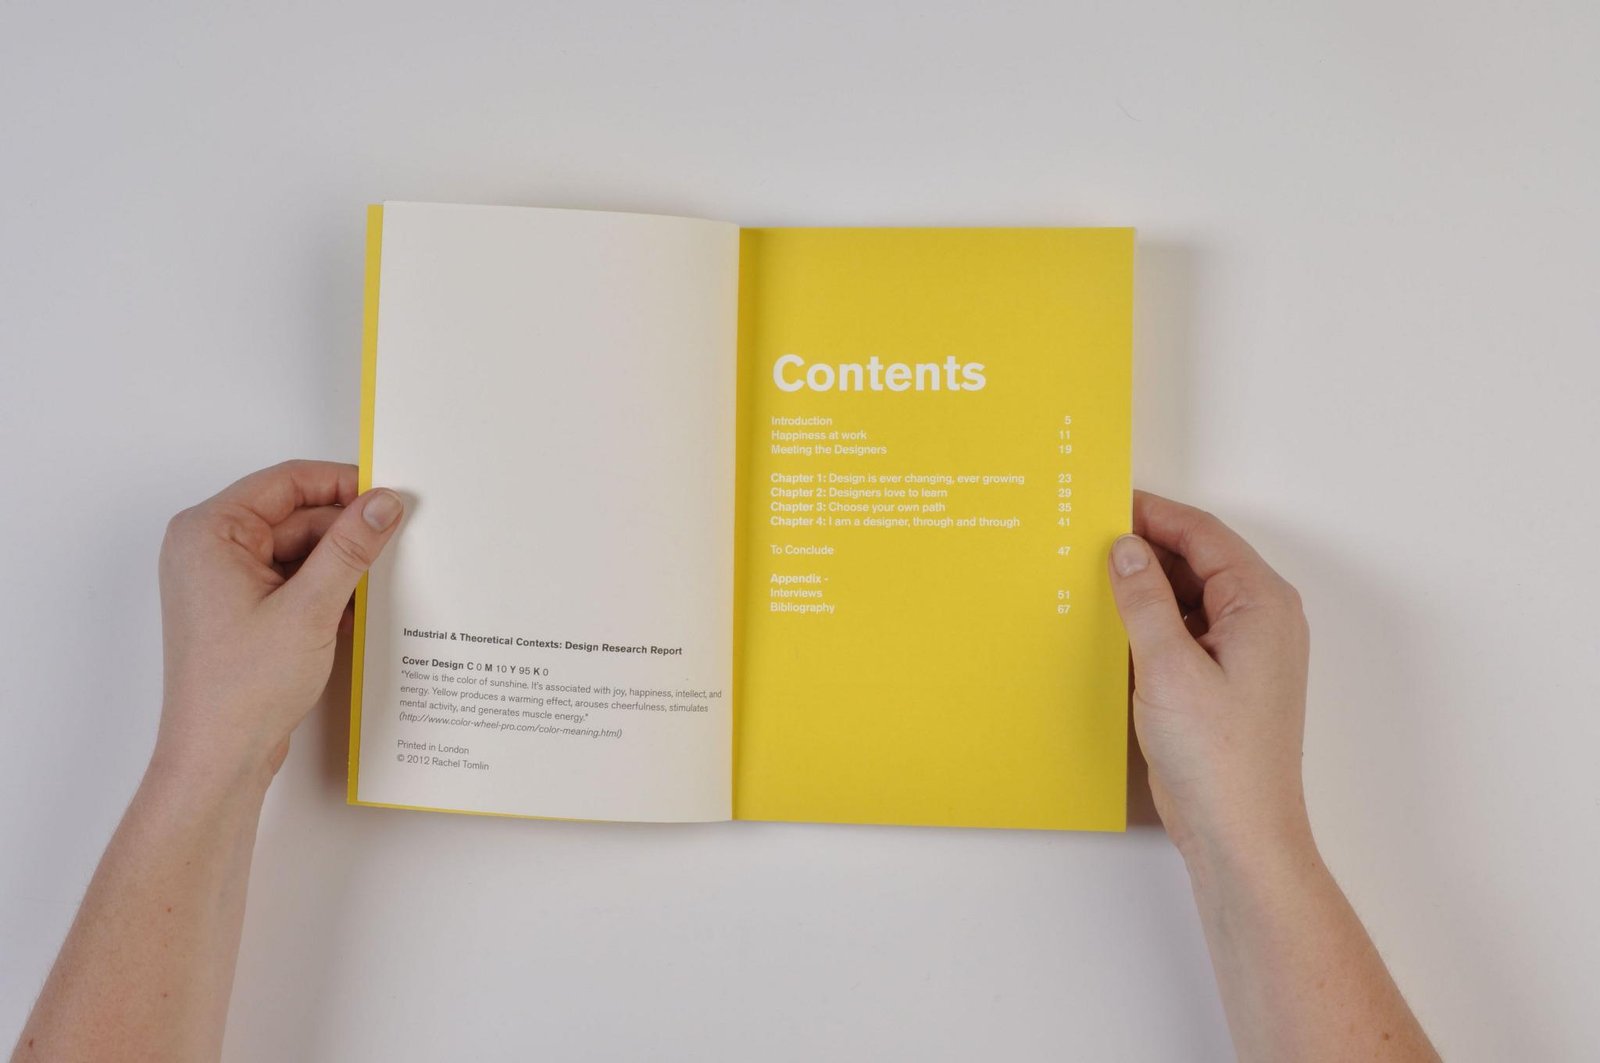
Furthermore, consistency in formatting helps maintain a professional appearance, aiding in the readability of the document. Adopting a standard citation style enhances credibility and allows readers to locate original sources efficiently. Here are some key formatting components:
| Component | Description |
|---|---|
| Title Page | The report’s title, author(s), and date. |
| Abstract | A brief summary of the report’s objectives and findings. |
| Introduction | Outlines the research question and objectives. |
| Methodology | Details the research approach and tools used. |
| Results | Presents the findings in an organized manner. |
| Discussion | Interprets the results and their implications. |
| Conclusion | Summarizes the key insights and offers recommendations. |

Crafting a Cohesive Narrative: The Art of Structuring Your Report
Every effective report begins with a clear understanding of its purpose and audience. This foundation allows you to organize your thoughts and present the information in a way that resonates with readers. Consider the following elements to create a structured flow:
- Introduction: Set the context and state the objectives.
- Methodology: Explain how data was collected and analyzed.
- Findings: Present the main results in a concise, digestible format.
- Discussion: Interpret the findings and tie them back to the objectives.
- Conclusion: Summarize key points and suggest further research or implications.
Utilizing clear headings and subheadings is crucial for guiding readers through your report. Additionally, tables can effectively consolidate complex data, making it accessible and understandable. Here’s a simple structure for a findings table:
| Finding | Significance |
|---|---|
| Finding 1 | Illustrates a major trend. |
| Finding 2 | Challenges existing theories. |
| Finding 3 | Proposes new perspectives. |
By adhering to this structured approach and incorporating visual aids, you not only enhance the readability of your report but also engage your audience effectively. Balance is key; maintain a professional tone while letting your unique voice shine through to captivate and inform your readers.

Visualizing Data: Effective Techniques for Graphical Representation
When it comes to making data accessible and understandable, utilizing effective graphical techniques is crucial. Various types of visually driven formats can aid in this mission, such as:
- Bar Charts: Ideal for comparing quantities across different categories.
- Line Graphs: Perfect for showing trends over time and how data points connect.
- Pie Charts: Useful for displaying proportions and percentages within a whole.
- Heat Maps: Excellent for visualizing complex data relationships and patterns.
Additionally, a well-structured table can enhance clarity and framework, allowing your audience to glean insights at a glance. An example of a simple yet effective table can be seen below:
| Data Type | Best Use Case |
|---|---|
| Bar Chart | Comparing values |
| Line Graph | Trend analysis |
| Pie Chart | Proportional data |
| Heat Map | Data density |
By employing these techniques and tools, researchers and analysts can better present their findings, fostering a deeper understanding of the data’s implications and significance.

Ensuring Clarity and Impact: Best Practices for Writing and Presentation
Clarity and impact are crucial elements in both writing and presenting your research report. To achieve this, consider the following best practices:
- Define Your Purpose: Clearly understand the aim of your report. Are you informing, persuading, or presenting findings? Keep this in focus while writing and designing your presentation.
- Use Visuals Effectively: Incorporate graphs, charts, and images to complement your data. This not only breaks up text but also enhances understanding.
- Simplify Language: Use straightforward language. Avoid jargon unless it’s defined in context, ensuring accessibility to a wider audience.
- Maintain Consistency: Use a uniform structure, font style, and color scheme throughout your document to create a cohesive look and feel.
In addition to these strategies, utilizing structured formats can play a significant role in clarity. Below is a simplified layout for presenting key findings:
| Finding | Impact |
|---|---|
| Increase in user engagement | 25% increase in retention rates |
| Improved response times | 30% faster than previous metrics |
| Higher satisfaction scores | 85% positive feedback from users |
The Way Forward
designing a research report is a meticulous process that balances clarity, structure, and analytical depth. By thoughtfully organizing your findings, employing a clear methodology, and articulating your conclusions, you create a document that not only informs but also engages your audience. Whether you are detailing complex data or presenting innovative insights, the essence of an effective research report lies in its ability to communicate your message persuasively and succinctly. As you embark on crafting your own research reports, remember that each section serves a purpose, inviting readers to traverse the journey of discovery alongside you. With careful attention to detail and a commitment to precise communication, your report can stand as a testament to the rigor of research and the value of shared knowledge. Let your work resonate in the academic arena and beyond, fostering understanding and inspiring future inquiries.


