research report description
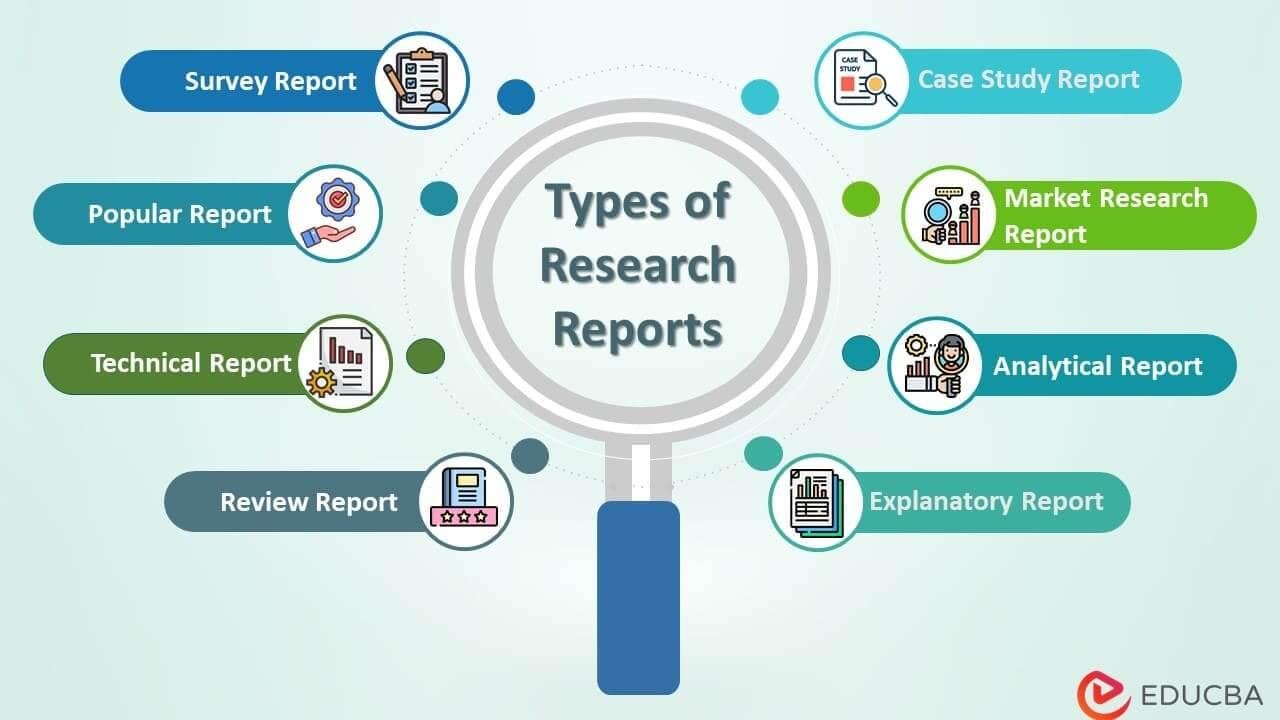
In an age where information is abundant yet often overwhelming, the ability to distill complex data into concise, actionable insights is invaluable. Research reports serve as crucial instruments in this endeavor, bridging the gap between raw data and informed decision-making. These reports are meticulously crafted documents that synthesize findings from organized research, shedding light on various challenges, particularly in business contexts. By presenting well-structured analyses and interpretations, research reports not only inform stakeholders but also guide strategic planning and innovation. In this article, we will explore the essence of research reports, their key components, and the best practices for writing them effectively, equipping you with the knowledge to harness the power of data in your own ventures. Whether you are a seasoned researcher or new to the field, understanding the nuances of research report creation can elevate your work and drive impactful results.
Understanding the Core Elements of a Research Report
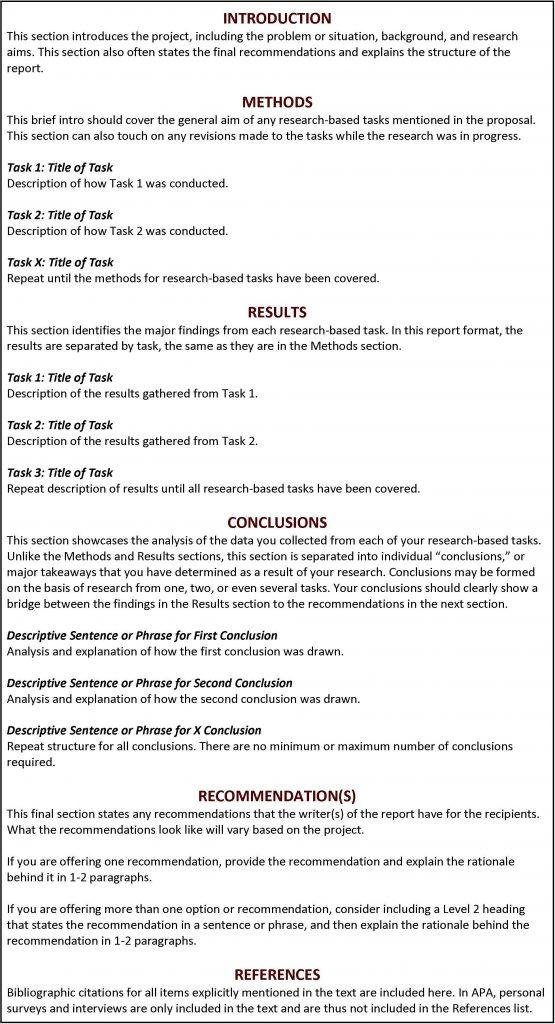
A research report is a structured document that encapsulates the findings of a research project. Its primary purpose is to communicate insights and conclusions drawn from systematic inquiries, enabling readers to grasp the significance of the work effectively. The typical anatomy of a research report includes several essential components, such as the introduction, which outlines the research question and objectives; the methodology, detailing the processes and techniques employed during the study; and the results, where data is presented in a clear format. Each of these sections plays a vital role in ensuring that the report is accessible and informative.
Furthermore, a well-crafted research report culminates in the discussion section, interpreting the results in the context of existing literature and suggesting implications for future research or practical applications. To facilitate comprehension, reports often include visual aids such as charts and tables, which summarize complex data succinctly. For example, a table may categorize various research trials along with their outcomes and methodologies, providing a quick reference for readers. The coherence and clarity of these core elements ensure that the report not only conveys information but also engages its audience in a meaningful dialogue about the research topic.
| Core Element | Description |
|---|---|
| Introduction | Defines the research question and goals. |
| Methodology | Details research design and approaches used. |
| Results | presents data and findings clearly. |
| Discussion | Interprets results and suggests implications. |
Unpacking Methodologies: Choosing the Right Approach
When embarking on a research project, the selection of a methodology is crucial to its success. Various methodologies can offer unique perspectives and insights, thus shaping the findings in profound ways. A few common approaches include:
- Qualitative Research: Focuses on understanding human behavior and the reasons that govern such behavior.
- Quantitative Research: Involves the systematic empirical investigation of observable phenomena via statistical, mathematical, or computational techniques.
- Mixed Methods: Combines both qualitative and quantitative approaches to enrich the findings.
The choice of a methodology often depends on the research question, the objectives of the study, and the type of data required. Each approach has its strengths and limitations that need careful consideration. An effective strategy can enhance the validity and reliability of research outcomes. Below is a simple comparison of methodologies that can assist in decision-making:
| Methodology | Focus | Data Type | Strengths |
|---|---|---|---|
| Qualitative | Exploratory Insights | Text and Narratives | Rich Data, Depth of Understanding |
| Quantitative | Statistical Analysis | Numerical Data | Generalizability, Objectivity |
| Mixed Methods | Comprehensive Analysis | Both Types | Holistic View, Balanced Perspective |
Interpreting Data: Beyond the Numbers
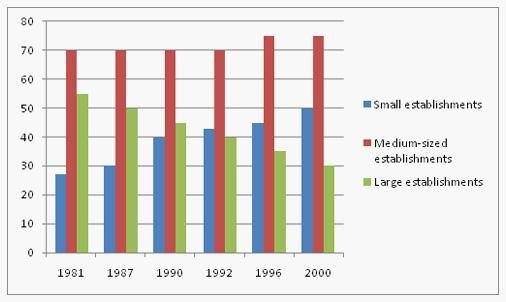
Interpreting data involves much more than simply crunching numbers; it requires a nuanced understanding of context and patterns. As researchers delve into their findings, they must consider factors such as the source of the data, potential biases, and the implications of how the data is presented. One effective strategy is to use visualization tools to portray data trends clearly. Here are some critical aspects to consider:
- Contextual Analysis: Assess the historical and social context surrounding the data.
- Pattern Recognition: Look for recurring themes or anomalies that may prove significant.
- Visual Representation: Utilize charts and graphs to synthesize complex data into understandable visuals.
Effective communication of data findings often hinges on the narrative developed around the numbers. This narrative should not only highlight the key results but also delve into the ‘why’ and ‘how’ behind the numbers. Engaging storytelling can bridge the gap between statistical analysis and real-world application, making insights more accessible. Consider incorporating the following elements:
- Impact Assessment: Evaluate what the data means for stakeholders.
- Recommendations: Provide actionable insights based on the interpreted data.
- Caveats: Acknowledge any limitations or uncertainties in the data.
| Data Interpretation Elements | Description |
|---|---|
| Contextual Analysis | Understanding the background influencing the data. |
| Pattern Recognition | Identifying significant trends or outliers. |
| Visual Representation | Using visuals to clarify data insights. |
Crafting Recommendations: From Insight to Action
“`html
Transforming insights gained from research into actionable recommendations requires a methodical approach that bridges analysis and practical implementation. By synthesizing relevant data, stakeholders can craft strategies tailored to address specific challenges while capitalizing on identified opportunities. This involves several key steps:
- Assessment: Evaluate the insights collected to understand their implications.
- Prioritization: Identify which recommendations will yield the highest impact.
- Collaboration: Engage with team members to gather diverse perspectives and refine ideas.
Once the recommendations are formulated, it is essential to present them clearly to ensure understanding and facilitate execution. Consider utilizing visual aids, such as tables, to enhance clarity and impact. Below is a simple table that outlines recommended actions based on various insights:
| Insight | Recommended Action | Expected Outcome |
|---|---|---|
| High customer churn rates | Implement a loyalty program | Increased customer retention |
| Low engagement on social media | Conduct a content audit | Enhanced interaction and reach |
| Declining sales in specific product lines | Launch targeted promotions | Boosted sales and visibility |
“`
The Way Forward
the significance of a research report cannot be overstated. As a vital tool for conveying the intricacies of research findings, it serves to bridge the gap between complex data and actionable insights. Whether you’re addressing academic peers, policymakers, or the general public, a well-structured research report not only presents information but also fosters understanding, encourages dialogue, and informs decisions. Embracing clarity and organization in your writing ensures that your findings resonate and inspire further inquiry. As we continue to navigate an ever-evolving landscape of information, the ability to craft an effective research report will remain a cornerstone of successful communication in the realm of research. For more detailed guidance, consider exploring resources that delve into the components and styles that define outstanding research reports [[1]](https://www.geektonight.com/research-report/) [[3]](https://dovetail.com/research/what-is-a-research-report/).


