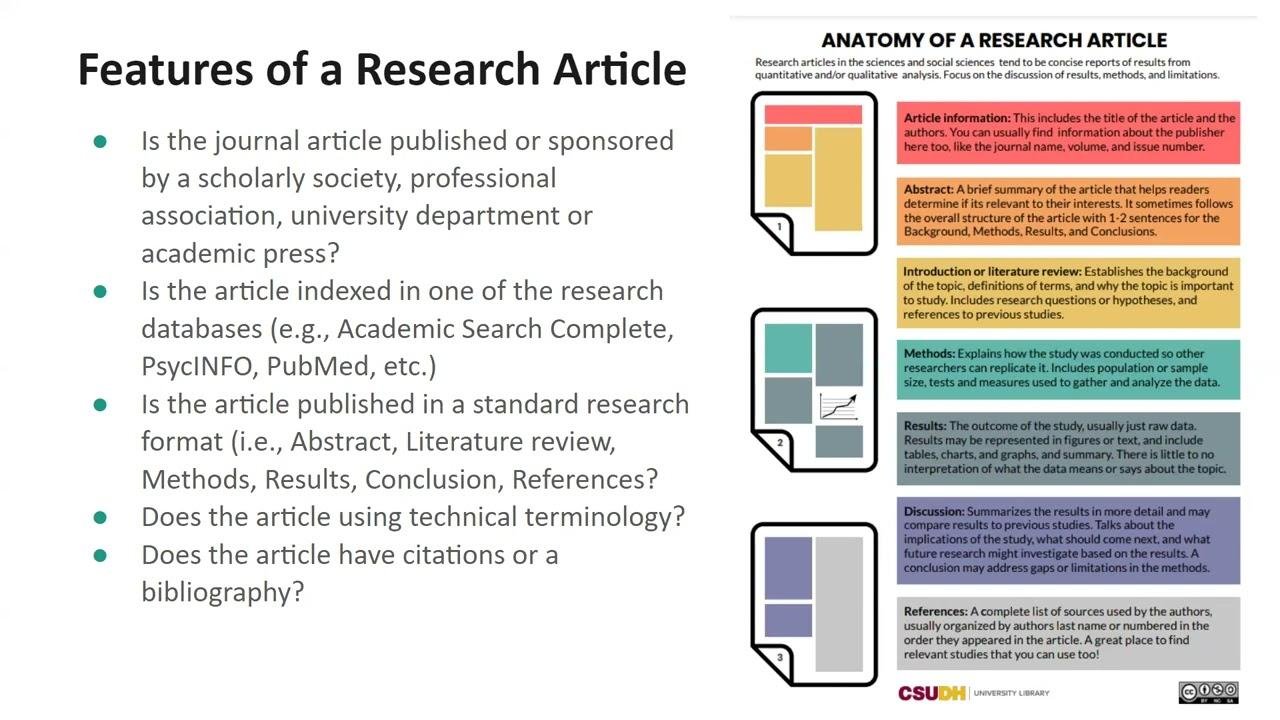
research report characteristics

In the realm of academia and professional inquiry, the research report stands as a pivotal tool for communicating findings and insights. Characterized by a structured format that highlights methodology, results, and conclusions, a well-crafted research report serves not only as a record of inquiry but also as a pathway for future exploration. It embodies the rigors of systematic investigation, demanding clarity and precision in its presentation to effectively inform its audience. This article delves into the essential characteristics of research reports—those defining elements that ensure they are not only informative but also persuasive and impactful. By exploring aspects such as organization, clarity, and evidence-based argumentation, we will uncover what makes a research report a cornerstone of scholarly and professional communication. Whether you are a seasoned researcher or a novice seeking to navigate the complexities of formal reporting, understanding these characteristics will enhance your ability to convey your findings with authority and integrity.
Understanding Clarity and Precision in Research Reporting
Effective research reporting hinges on the clarity and precision of the information conveyed. Clarity ensures that the audience can grasp the key ideas without ambiguity. This can be achieved by employing straightforward language and logical structure throughout the report. To enhance clarity, consider the following guidelines:
- Use clear and concise language.
- Organize content into coherent sections.
- Avoid jargon unless absolutely necessary, and explain any complex terms used.
- Incorporate visual aids, such as charts and graphs, to represent data meaningfully.
Precision, on the other hand, focuses on the accuracy of details presented within the research report. This requires the careful presentation of data and findings, ensuring that every claim is backed by relevant evidence. Key practices to achieve precision include:
- Double-checking data and calculations for errors.
- Providing exact figures, including units of measurement.
- Referencing sources for all citations to maintain credibility.
- Including tables or figures to summarize complex data for easier comprehension.
| Characteristic | Importance |
|---|---|
| Clarity | Facilitates understanding and retention of information |
| Precision | Ensures accuracy and credibility of research findings |

The Role of Structure and Organization in Communicating Findings
In crafting a research report, the way findings are structured and organized plays an essential role in enhancing clarity and comprehension. A well-structured report serves not only to present data but also to guide readers through the narrative of research. Key components that contribute to effective organization include:
- Clear headings and subheadings: These allow readers to navigate the document easily and understand the flow of information.
- Logical progression: Information should build upon previous sections to develop a coherent argument or narrative.
- Visual aids: Charts, tables, and graphs can highlight crucial findings and break up text to maintain reader engagement.
Additionally, utilizing standardized formats, such as tables, can significantly enhance the interpretability of data. For example, a concise comparison of key findings can instantly convey essential insights:
| Study | Key Finding | Implication |
|---|---|---|
| Study A | Higher engagement rates with multimedia | Recommend incorporating videos for better retention |
| Study B | Significant correlation between layout and readability | Suggest standardized formats to enhance accessibility |
Using these strategies helps ensure that findings are not only presented effectively but are also readily accessible to the intended audience, facilitating better understanding and application of the research results.

Emphasizing Relevance and Contextualization in Research Reports
Research reports thrive on their ability to communicate findings effectively, an aspect that heavily hinges on the relevance of the content presented. When crafting a report, it is crucial to ensure that each piece of data and discussion point directly aligns with the research question or hypothesis. This not only strengthens the argument but also enhances the reader’s understanding. Key considerations here include:
- Target Audience: Tailoring the language and depth of information based on the expected readers.
- Current Trends: Incorporating recent studies and data that are applicable to the topic at hand.
- Practical Implications: Discussing how the findings can be applied in real-world scenarios.
Moreover, contextualization plays a significant role in how effectively research is perceived. A research report should not exist in isolation; it needs to connect with the broader discourse surrounding its subject matter. This involves integrating relevant background information, theoretical frameworks, and previous studies, which can help the audience grasp the significance of the findings. Consider the following table as an example of how to structure relevant contextual information:
| Aspect | Description |
|---|---|
| Background Literature | Summarizes existing research related to the topic. |
| Theoretical Framework | Explains the theories that underpin the research. |
| Information Gaps | Identifies what the current study aims to address. |

Incorporating Visual Aids for Enhanced Comprehension and Engagement
Integrating visual aids into your research report presents a significant opportunity to boost both comprehension and engagement among your audience. When presented alongside textual information, visual elements such as diagrams, charts, and infographics can clarify complex ideas, making them more digestible. For instance, incorporating charts can effectively illustrate trends, while diagrams can break down intricate processes, streamlining the audience’s understanding. By adopting a clear structure in your visual presentations, you not only enhance grasp but also maintain interest, ensuring that key points resonate with your readers.
Moreover, consider utilizing a variety of visual formats to cater to different learning preferences. Elements like tables can provide concise comparisons, while graphs demonstrate quantitative data in an engaging manner. To maximize the effectiveness of your visuals, focus on the following best practices: simplify your designs, ensure relevance to your content, and maintain consistency in style. By thoughtfully incorporating these elements, you create a more dynamic interactive experience that not only holds attention but also fosters a deeper understanding of your research findings.
| Type of Visual Aid | Best Use |
|---|---|
| Charts | Illustrating trends and comparisons |
| Diagrams | Explaining processes and relationships |
| Infographics | Summarizing key points visually |
| Tables | Presenting data for easy reference |
The Way Forward
crafting a compelling research report is akin to weaving a tapestry of inquiry, precision, and insight. The characteristics outlined—clarity, structure, objectivity, and thoroughness—are not mere checkboxes but the very threads that bind your findings into a meaningful narrative. As you embark on your future research endeavors, remember that a well-crafted report doesn’t just convey information; it invites readers into a world of discovery, encouraging them to engage with the data and draw their own conclusions.
Embracing these essential traits not only enhances the credibility of your work but also empowers others to build upon your findings. As the landscape of research continues to evolve, let us strive to uphold these standards, fostering a tradition of excellence in scholarship. With every report you produce, you contribute to the larger mosaic of knowledge, illuminating paths for inquiry yet to come. So, as you pen your findings, think beyond the page—your research has the potential to spark conversations, inspire innovation, and ultimately shape the future.


