research report body

Introduction to the Research Report Body
In the landscape of academia and professional fields, the research report stands as a crucial vessel for conveying complex findings and insights. At the heart of any effective research report lies its body, the structured narrative that presents data, analyses, and interpretations. This pivotal section transforms raw information into a cohesive argument, guiding readers through the intricacies of the research. Just as an architect meticulously designs the framework of a building, the construction of the research report body requires careful planning and rigorous adherence to methodological principles. Here, we will explore the essential components that comprise this section, the balance of evidence and analysis it demands, and the strategies for crafting an engaging and informative narrative that resonates with its audience. As we delve into the anatomy of a research report body, we discover not only the art of clear communication but also the science of effective scholarship. Through this exploration, we aim to illuminate best practices that will empower writers to present their findings with clarity and conviction, ensuring their contributions are both valued and impactful.
Understanding the Structure of a Research Report Body
The body of a research report is fundamentally structured to facilitate a clear presentation of the research objectives, methods, findings, and interpretations. Generally, it comprises several key sections that provide a roadmap for readers, enabling them to navigate through the complexities of the research. Emphasizing clarity and logical flow, the main components often include:
- Introduction: Sets the stage by outlining the research problem and objectives.
- Literature Review: Discusses existing research and contextualizes the current study.
- Methods: Details the experimental or analytical techniques employed.
- Results: Presents findings in a structured manner, often using tables and figures.
- Discussion: Interprets the results, explores their significance, and suggests implications.
Particularly, the Results section deserves special attention as it showcases the raw data in a digestible format. Utilizing tables can enhance clarity and provide a concise summary of complex information. A well-structured table can effectively highlight key findings without overwhelming the reader. For instance, consider the following sample layout:
| Finding | Value |
|---|---|
| Sample Size | 150 |
| Average Score | 85% |
| Statistical Significance | p < 0.05 |

Key Components: Crafting Engaging and Informative Content
Creating engaging and informative content is essential for capturing the attention of your audience and ensuring they remain interested. The key lies in understanding your target demographic and what resonates with them. Consider implementing the following components to enhance your content:
- Clarity: Use straightforward language and structure to make complex ideas more digestible.
- Relevance: Tailor your topics to align with the interests and needs of your audience.
- Storytelling: Integrate compelling narratives that evoke emotions and create a connection.
- Visuals: Incorporate images, infographics, and videos to complement and break up text.
Moreover, the use of data and evidence can significantly boost the credibility of your content. Craft informative sections by utilizing well-structured tables and visuals that summarize key points effectively. Consider the following table to illustrate the importance of these components:
| Component | Description |
|---|---|
| Clarity | Simplifies complex information for better understanding. |
| Relevance | Ensures content aligns with audience interests. |
| Storytelling | Engages audience emotionally and cognitively. |
| Visuals | Enhances comprehension and retention. |

Data Presentation: Balancing Clarity and Depth in Analysis
In the realm of data analysis, effective presentation is key to bridging the gap between intricate details and overall understanding. A well-structured report should prioritize clarity without sacrificing depth. This delicate balance is achieved by using concise language and enhancing visual appeal. Techniques such as integrating infographics and charts can significantly elevate comprehension. Here are some strategies to enhance data presentation:
- Utilize clear headings and subheadings for navigation.
- Incorporate bullet points to summarize key findings.
- Apply color coding for easy differentiation between data sets.
- Present data in various formats (tables, graphs, charts) to cater to diverse learning styles.
Furthermore, the choice of data visualization can greatly impact the interpretation of results. For instance, a well-structured table can allow for quick insights while enabling a deeper exploration of the underlying numbers. Below is an example of a simple comparison table showcasing sample data analysis results:
| Parameter | Group A | Group B |
|---|---|---|
| Average Score | 85 | 78 |
| Response Rate (%) | 92 | 89 |
| Engagement Level | High | Medium |

Recommendations for Effective Conclusion and Summary Sections
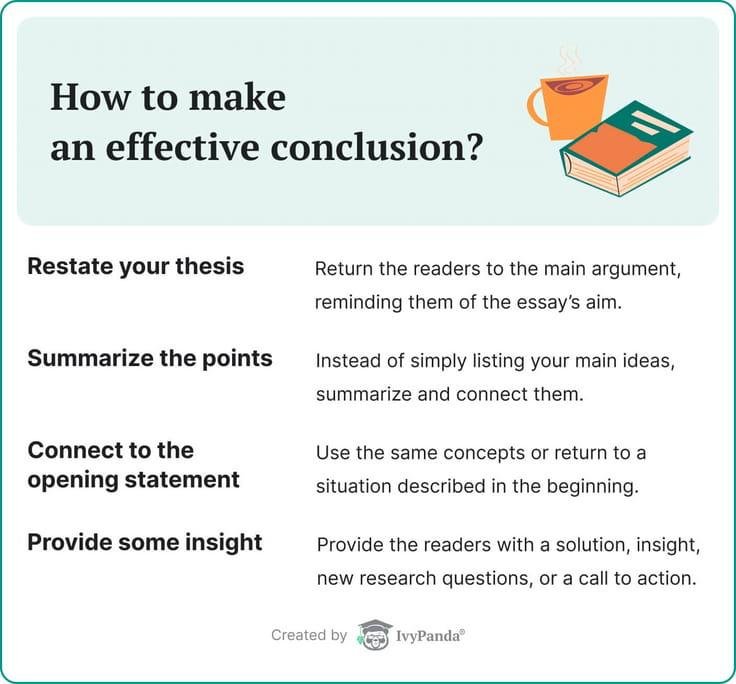
Crafting an impactful conclusion and summary section is crucial in solidifying the reader’s grasp of the research report’s key findings. To achieve this, it is essential to integrate the main themes discussed throughout the report. Start by revisiting the central objectives and outcomes, making sure to highlight significant insights that emerged from your analysis. Using clear and concise language allows the reader to easily revisit the essential points without feeling overwhelmed by excessive details. Ensure that your conclusions are drawn directly from the research data, providing a direct link between your findings and the implications presented.
To enhance the readability and engagement of the conclusion, consider employing structured elements like lists or tables. This helps in presenting the information clearly. For instance, you might include a table summarizing the lessons learned from your study, or key recommendations that stem from your findings:
| Key Recommendations | Expected Outcomes |
|---|---|
| Implement data-driven strategies | Improved performance metrics |
| Encourage stakeholder engagement | Enhanced collaboration |
| Promote continuous learning | Innovation and adaptability |
By structuring the conclusion this way, you not only provide clarity but also reinforce the most actionable takeaways from your research. This approach facilitates a smoother transition for readers into applying the knowledge gained from your findings. Always remember, a strong conclusion leaves a lasting impression and ensures that your research is remembered long after the reading is done.
Concluding Remarks
the body of a research report serves as the backbone of your scientific narrative, where the complexities of your findings unfold and support your central arguments. It is not merely a collection of data; rather, it is a meticulously crafted argument that guides the reader through your methodology, results, and interpretations. By ensuring clarity and logical flow, each section of the body invites readers to engage with your research in a meaningful way.
As you embark on writing the body of your next research report, remember that it is your opportunity to communicate the significance of your work. It is where you present evidence that adds weight to your conclusions, illustrating the relevance of your research within the broader field. Crafting a well-structured body will not only enhance the readability of your report but also elevate your contributions to ongoing dialogues in your discipline. With each section, you can inspire understanding and curiosity, ultimately fostering a greater appreciation for your findings and their implications for future research.
In essence, the body of your research report is your chance to shine—make it resonate, and let your insights take center stage.


