equity research report template

Introduction to Equity Research Report Templates
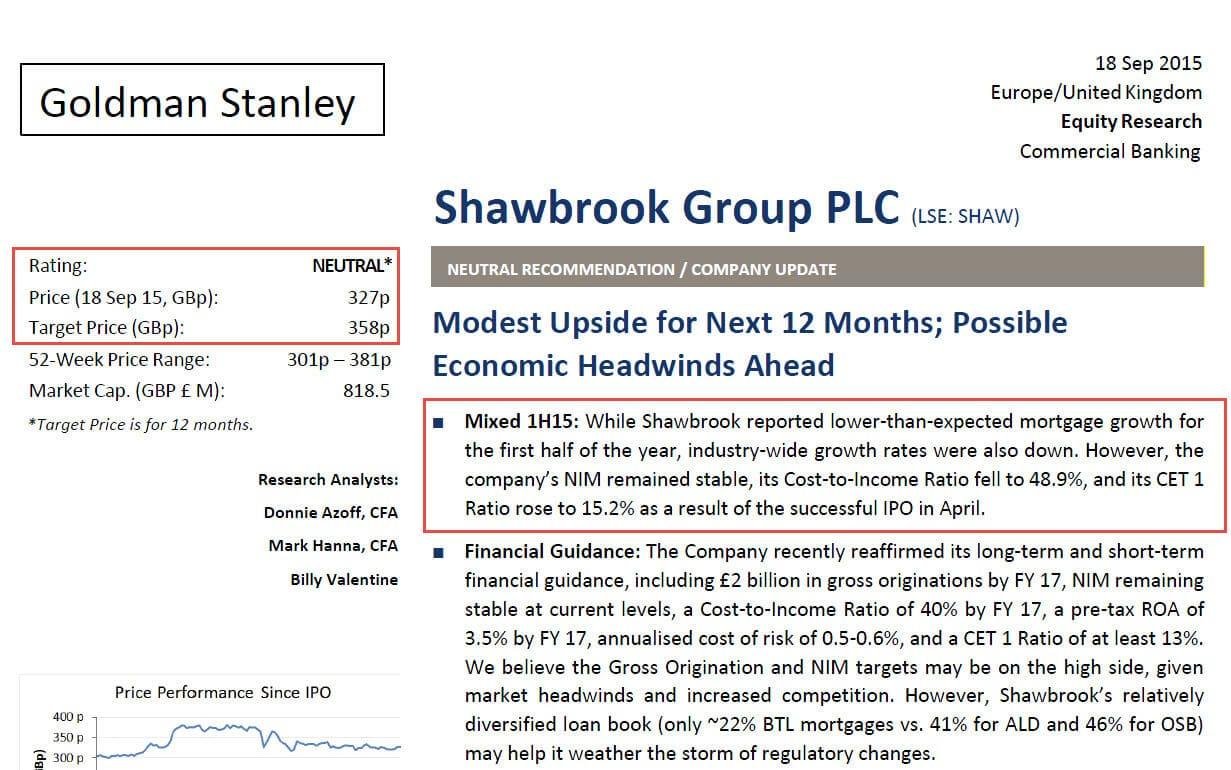
In the fast-paced world of finance and investment, clarity and precision are paramount. An equity research report serves as a critical tool for analysts and investors alike, providing an in-depth assessment of public companies and their stock potential. These reports encapsulate a wealth of information, including the company’s operational performance, market conditions, and strategic positioning, all while offering actionable recommendations—buy, hold, or sell. However, creating a comprehensive equity research report can be daunting without a clear framework. This is where an equity research report template comes into play, serving as a guiding blueprint that streamlines the writing process and ensures all essential elements are covered. Whether you are a seasoned analyst or a novice in the realm of equity research, understanding how to utilize a template can enhance your reporting accuracy and effectiveness, fostering informed investment decisions in an ever-evolving market landscape.
Understanding the Essentials of an Equity Research Report Template
Crafting an effective equity research report template involves incorporating essential elements that provide clarity and depth to the analysis. A robust template typically includes key sections such as:
- Executive Summary: A concise overview of the report’s findings and recommendations.
- Company Overview: Details about the business model, management team, and market position.
- Financial Analysis: Critical assessment of financial statements, including ratios and trends.
- Valuation: Comparison of valuation methods such as DCF and multiples.
- Risks and Opportunities: Identification of significant risk factors and potential growth avenues.
This structured approach not only enhances readability but also ensures that investors can quickly grasp the vital information required for informed decision-making.
Additionally, utilizing a clear and organized layout can greatly improve the report’s effectiveness. Consider incorporating visual aids like charts and tables to represent financial data and trends visually. For instance, a table summarizing key financial metrics might look like this:
| Metric | Q1 2024 | Q4 2023 |
|---|---|---|
| Revenue | $1.2M | $1.0M |
| Net Income | $300k | $250k |
| EBITDA Margin | 25% | 22% |
This format not only captures the reader’s attention but also facilitates easier comparison of financial performance over time, highlighting trends that could be pivotal for investment assessments.

Key Components for Crafting a Comprehensive Analysis
To craft a compelling analysis, begin by establishing a clear structure that guides readers through key insights. Incorporate essential elements such as:
- Executive Summary: A succinct overview of the research findings。
- Company Overview: Background information including history, mission, and vision.
- Financial Performance: Key metrics such as revenue, profit margins, and growth rates.
- Industry Analysis: Insights into market trends, competitive landscape, and potential risks.
- Valuation: Different methodologies used to assess the company’s worth.
Next, ensure that your analysis is data-driven and well-supported. Utilize graphs and tables to visualize trends and comparisons, enhancing clarity. Consider including:
| Metric | Q1 2024 | Q2 2024 | Growth (%) |
|---|---|---|---|
| Revenue | $2M | $2.5M | 25% |
| Net Income | $500K | $750K | 50% |
Conclude with actionable recommendations based on the analysis, giving investors a clear direction on potential outcomes and the impact of external factors.

Best Practices for Data Visualization in Equity Reports
html
When crafting equitable research reports, it's essential to prioritize clarity and accessibility in data visualization. Use simple graphics that can instantly communicate your main findings. This can include a combination of bar charts to display comparative data, line graphs for trends over time, and pie charts to represent percentages. Always label your visuals clearly and choose contrasting colors to make differences stand out. Avoid cluttering your visuals with excessive information or complex legends; simplicity often leads to more impactful insights. Consider adopting an organized layout that group related visuals to enhance viewer comprehension.

Additionally, it's beneficial to employ interactive elements when possible, such as hover-over data points or clickable regions that provide more in-depth analysis. This enhances user engagement and allows stakeholders to explore the data according to their interests. Make sure to provide context for your visuals through concise explanations or complementary text, ensuring they do not stand alone but rather support the overall narrative of your equity findings. Below is a simple overview table that can be included in your reports to summarize key equity performance metrics:


      Metric
      Q1
      Q2
      Q3
      Q4


      Return on Equity (%)
      15
      18
      20
      22


      Equity-to-Asset Ratio (%)
      35
      33
      37
      40


      Net Profit Margin (%)
      10
      12
      14
      15

Enhancing Credibility with Robust Recommendations and Conclusions
To establish strong recommendations and conclusions within an equity research report, it’s essential to incorporate a systematic methodology that underscores analytical rigor. Begin with thorough data collection, ensuring that all sources are reliable and up-to-date. An effective approach may include:
- Comparative Analysis: Evaluate industry peers to contextualize performance metrics.
- Valuation Models: Utilize models such as DCF, P/E, and EV/EBITDA to formulate price targets.
- Market Trends: Highlight macroeconomic factors influencing sector dynamics.
Following a robust analytical process, present clear and actionable conclusions that resonate with the reader. Utilize concise language and avoid jargon where possible. Add supporting visuals, such as the table below to summarize key financial metrics, enabling stakeholders to grasp the recommendations effortlessly:
| Metric | Q2 2024 | Q1 2024 |
|---|---|---|
| Revenue Growth | 15% | 10% |
| Net Income Margin | 20% | 18% |
| Debt to Equity Ratio | 0.5 | 0.6 |
These insights not only bolster the credibility of your findings but also aid clients in making informed investment decisions. By consistently applying these principles, equity researchers can enhance the value of their reports while building trust with their audience.
The Conclusion
an equity research report template serves as a vital tool for analysts and investors alike. By providing a structured framework for analysis, these templates streamline the evaluation process and enhance the clarity of complex financial information. As markets continue to evolve and the demand for comprehensive insights grows, adopting a well-designed template can significantly improve the quality and consistency of research outputs. Whether you’re a seasoned professional or just beginning your journey in equity research, leveraging these templates can empower you to make informed decisions and navigate the intricate world of investments with confidence. Embrace the power of organization, and let your insights shine through on every page of your equity research report.


