Create Power Bi Report Dynamics 365
Unlocking Insights: Creating Power BI Reports for Dynamics 365
In today’s data-driven business landscape, organizations are increasingly turning to advanced analytics to unlock actionable insights and drive informed decision-making. Among the leading tools available, Microsoft Power BI stands out as a robust platform that enables users to transform their raw data into rich visual reports and dashboards. When integrated with Dynamics 365, Power BI opens a new realm of possibilities for businesses seeking to enhance their operational efficiency and strategic planning. This article delves into the intricacies of creating Power BI reports tailored for Dynamics 365, guiding readers through the essential steps, best practices, and innovative strategies to harness the full potential of this powerful combination. Whether you are a data analyst, business intelligence professional, or a decision-maker looking to leverage data effectively, understanding how to create compelling reports in Power BI will equip you with the tools needed to propel your organization forward.
Table of Contents
- Understanding the Integration of Dynamics 365 with Power BI
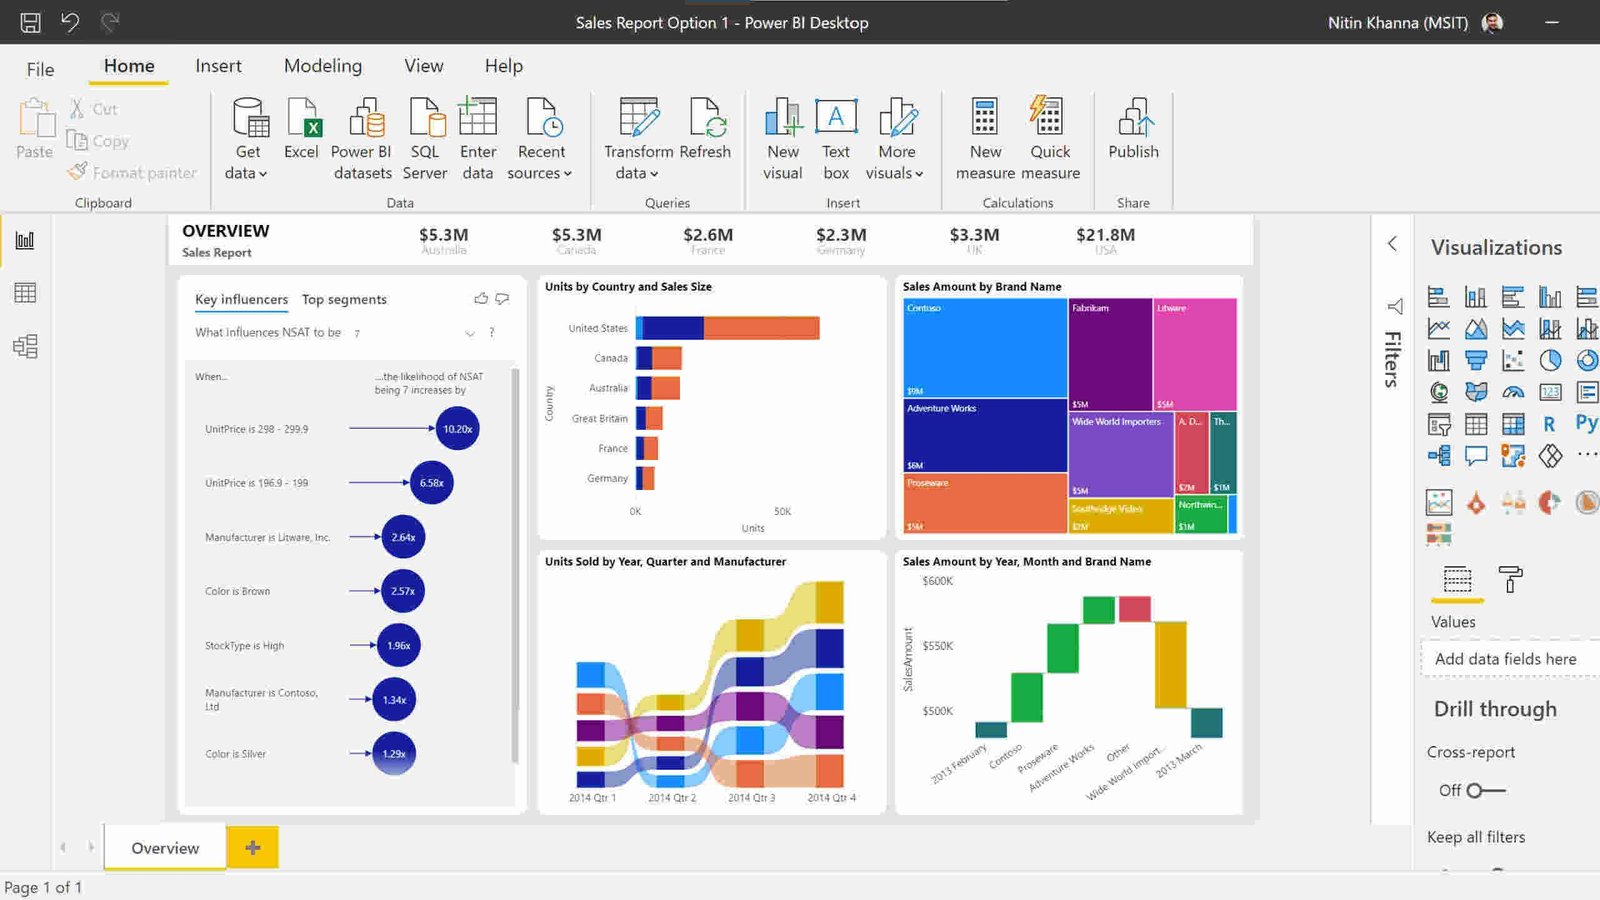
- Key Features of Power BI for Enhanced Data Visualization
- Step-by-Step Guide to Developing Effective Power BI Reports
- Best Practices for Optimizing Your Reports and Dashboard Performance
- Q&A
- In Conclusion
Understanding the Integration of Dynamics 365 with Power BI
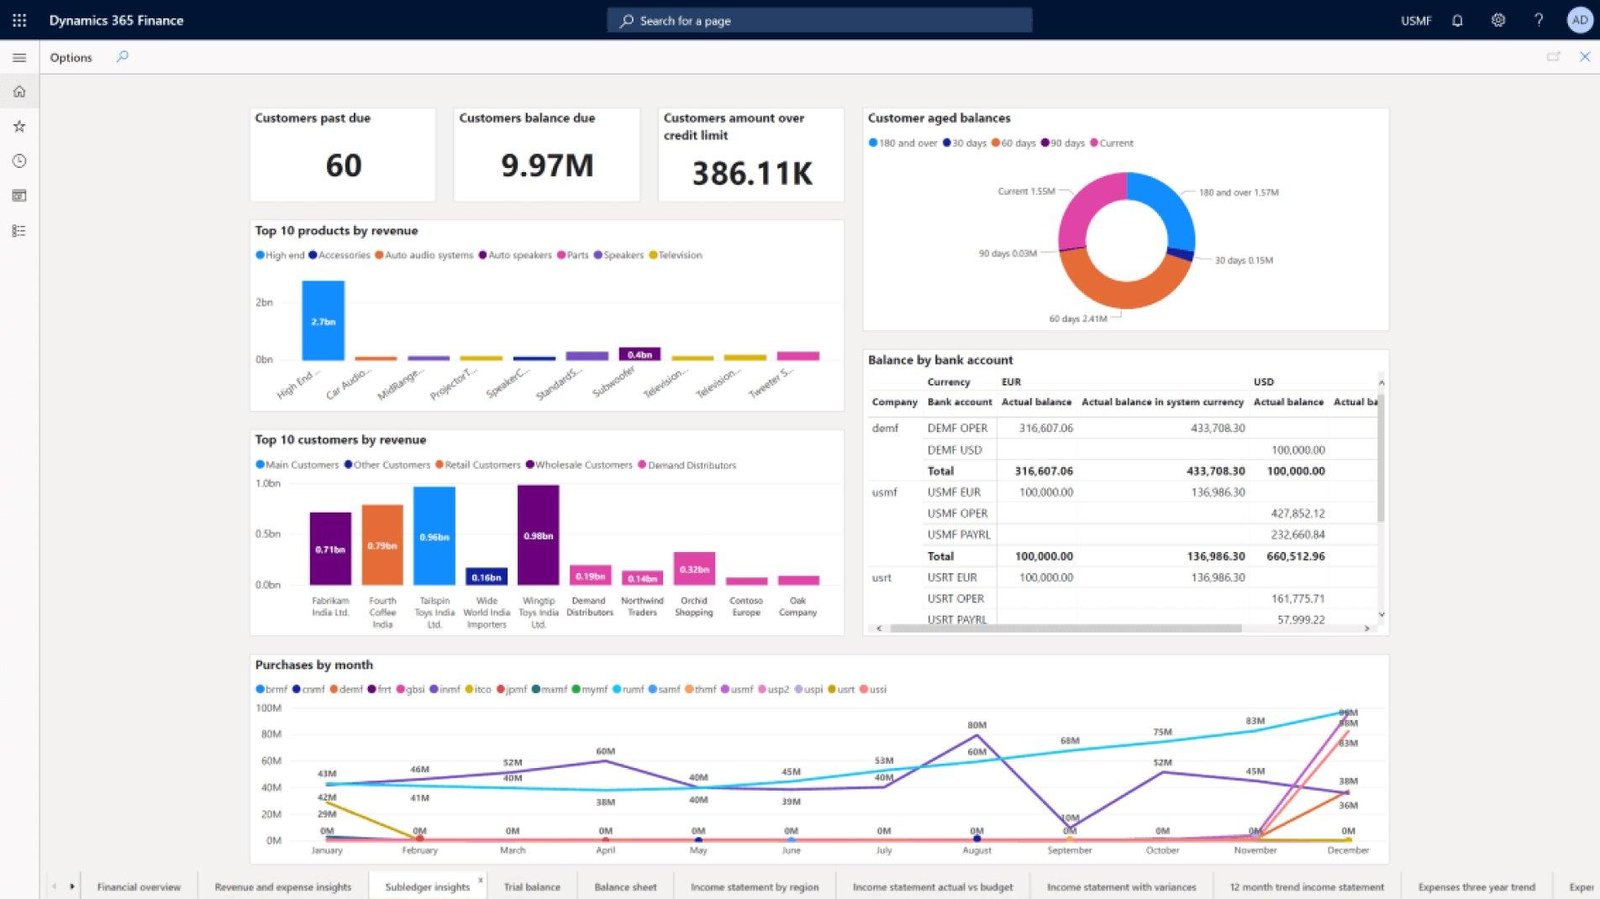
The integration of Dynamics 365 with Power BI transforms raw data into insightful visualizations, empowering businesses to make informed decisions. By seamlessly connecting these two robust platforms, organizations can leverage their operational data to uncover trends and patterns that are crucial for strategic planning. This synergy allows users to access real-time analytics directly from their Dynamics 365 environment, enhancing productivity while promoting a data-driven culture. Key features of this integration include:
- Real-Time Data Access: Instantly connect to live data sources for timely reporting.
- Custom Visualizations: Create tailored dashboards that reflect specific business objectives.
- Interactive Reports: Enable users to drill down into data for detailed insights.
Furthermore, this integration supports a variety of data sources, enabling users to bring together information from different departments for comprehensive analysis. Organizations can easily embed Power BI reports within their Dynamics 365 dashboards, ensuring all team members have access to relevant analytics which encourages collaboration across departments. Consider the following comparison of common reporting tools within Dynamics 365:
| Feature | Dynamics 365 Reporting | Power BI Reporting |
|---|---|---|
| Real-time Updates | No | Yes |
| Customization Options | Limited | Extensive |
| Data Visualization | Basic | Advanced |
Key Features of Power BI for Enhanced Data Visualization
html
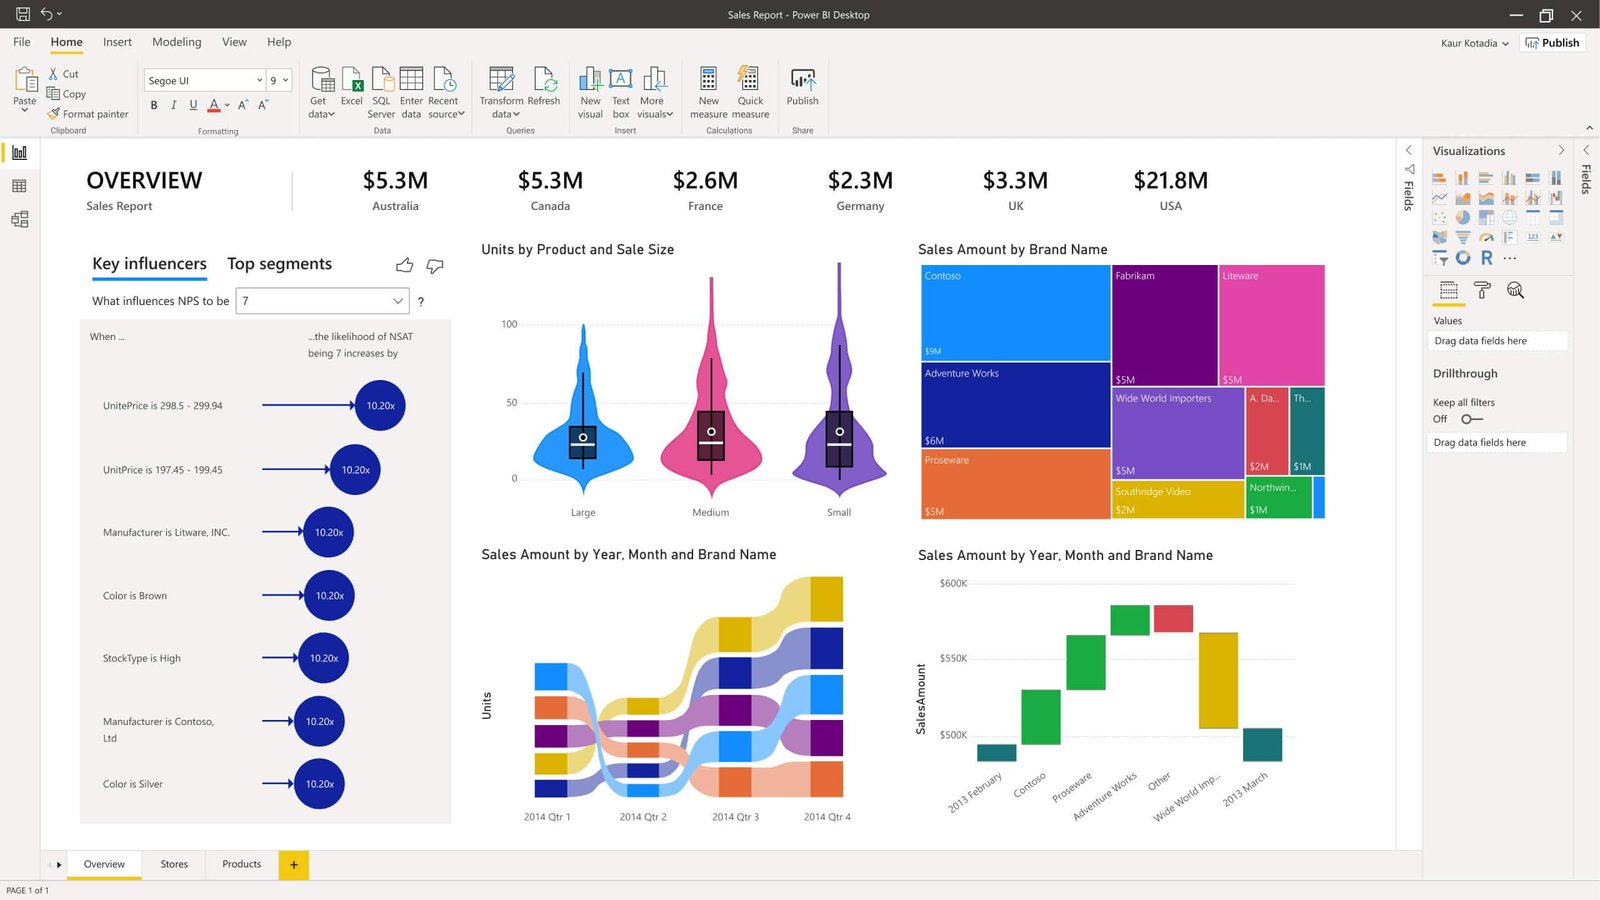
Power BI is a powerful tool that enhances data visualization through a range of intuitive features, enabling users to make sense of complex datasets easily. One of its standout capabilities is interactive dashboards, which allow organizations to visualize key metrics and trends at a glance. Users can drill down into each visual element to reveal detailed insights, fostering a deeper understanding of the data. Additionally, Power BI supports real-time data updates, ensuring that the information displayed is always current for effective decision-making. Other essential features include:
- Custom Visuals: Tailor dashboards with a variety of visualization options, from charts to maps.
- Natural Language Query: Users can pose questions in plain language and receive visual answers instantly.
- Data Connectivity: Seamlessly integrates with various data sources, including Dynamics 365, Excel, and cloud-based databases.
Another innovative feature of Power BI is the Power Query Editor, which simplifies the data preparation process. This editor allows users to clean and transform data without requiring advanced coding skills, making data analysis accessible to all team members. Moreover, Power BI's robust collaboration features enhance teamwork by allowing multiple users to share reports and insights effortlessly. These capabilities empower businesses to build a data-driven culture that leverages the full potential of their data assets. Here are more features to explore:
Feature
Description
Mobile Access
Access reports and dashboards on-the-go via mobile devices.
AI-driven Insights
Machine learning models provide predictive analytics and automated insights.
Data Role Security
Control data access at a granular level to ensure security and compliance.
Step-by-Step Guide to Developing Effective Power BI Reports
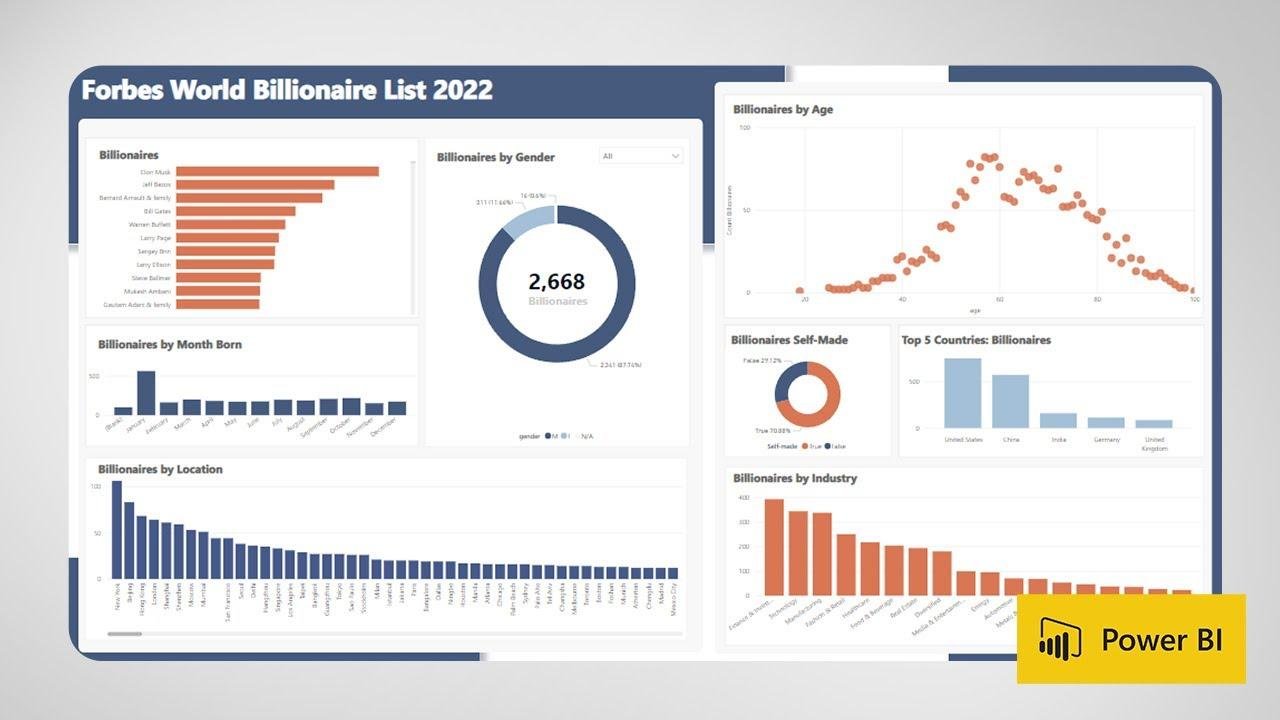
Creating impactful Power BI reports from Dynamics 365 data requires a systematic approach to ensure that the insights presented are both relevant and actionable. To begin, it’s crucial to outline your objectives clearly. Identify key performance indicators (KPIs) and the specific questions you want the report to answer. This foundational step helps in designing a report that not only meets user needs but also drives decision-making. Consider utilizing the available data models within Dynamics 365, which can provide a rich and structured dataset for your reporting. Once you have defined your objectives, connect Power BI to your Dynamics 365 environment and choose the necessary datasets that align with your report goals.
Next, focus on designing the report layout to enhance readability and engagement. A well-structured report typically includes the following elements:
- Data Visualizations: Use charts, graphs, and maps to present complex data in an easily digestible format.
- Filters and Slicers: Implement interactive features that allow users to customize their view of the data.
- Summary Cards: Highlight key metrics at the top of the report for quick insights.
Utilizing a cohesive color scheme and visual hierarchy can significantly improve the user experience. Additionally, it is essential to ensure that the report can be shared easily with stakeholders. By leveraging Power BI’s sharing capabilities and embedding options, you can keep your team informed and aligned on performance metrics in real-time.
Best Practices for Optimizing Your Reports and Dashboard Performance
To enhance your Power BI reports and dashboards, it’s crucial to implement certain best practices that improve performance while maintaining an intuitive user experience. Reducing the dataset size is one of the most effective strategies. This can be achieved by filtering data at the source during data import and using query folding capabilities. Additionally, optimizing visuals by limiting the number of visuals on each page and leveraging bookmarks can significantly speed up the load times. Here are some essential tips:
- Use the appropriate data types: Ensure data fields are assigned the correct types to avoid unnecessary processing.
- Avoid complex calculations: Use measures instead of calculated columns wherever possible.
- Limit the use of slicers: Reduce the number of slicers or dropdowns to optimize performance.
Furthermore, regularly reviewing and refining your reports is vital. Utilize performance analyzer tools in Power BI to identify bottlenecks and improve load times. Implementing an efficient data model architecture, such as using star schemas, enhances report responsiveness. Also, consider utilizing aggregated tables as they can summarize data without sacrificing the detail needed for analysis. The following table summarizes some effective strategies to optimize your reports:
| Strategy | Description |
|---|---|
| Data Model Optimization | Organize data into star schemas for better performance. |
| Aggregation | Create aggregated tables to summarize data and reduce processing. |
| Efficient DAX | Write efficient DAX expressions that minimize calculations during runtime. |
Q&A
Q&A: Creating Power BI Reports from Dynamics 365
Q: What is the significance of integrating Power BI with Dynamics 365?
A: Integrating Power BI with Dynamics 365 is crucial for businesses seeking to harness their data effectively. This integration allows organizations to visualize and analyze their Dynamics 365 data dynamically, transforming raw information into actionable insights. By leveraging advanced analytics, users can make informed decisions, identify trends, and enhance overall business performance.
Q: What are the basic steps to create a Power BI report using Dynamics 365 data?
A: The process typically involves several key steps:
- Connect to Dynamics 365: Begin by selecting the appropriate data connector in Power BI, connecting to your Dynamics 365 instance.
- Select and Import Data: Identify the specific data entities you wish to analyze and import them into Power BI.
- Data Transformation: Utilize Power Query to clean and reshape your data as needed, ensuring it meets your reporting requirements.
- Design the Report: Use Power BI’s drag-and-drop interface to create visualizations, arrange them on your report canvas, and customize them to tell your story effectively.
- Share and Collaborate: After finalizing your report, publish it to the Power BI service for sharing with stakeholders, enabling collaborative insights across teams.
Q: What types of visualizations can users expect to create?
A: Users can create a variety of visualizations, including:
- Bar and column charts
- Line and area graphs
- Pie and donut charts
- Tables and matrices
- Maps for geographical data representation
- KPIs and gauges for quick performance metrics
The flexibility of Power BI allows users to tailor visualizations to their specific needs, ensuring clarity and impact.
Q: Are there any special considerations or challenges when working with Dynamics 365 data?
A: Yes, there are several considerations to keep in mind:
- Data Volume: Dynamics 365 can generate vast amounts of data. It’s crucial to efficiently manage which datasets are imported to optimize performance.
- Security & Permissions: Ensure that users have appropriate access rights in both Dynamics 365 and Power BI to avoid data security issues.
- Data Refresh: Setting up scheduled refreshes is important to ensure that your Power BI reports reflect the most current data from Dynamics 365.
Q: How does Power BI enhance reporting compared to standard Dynamics 365 reporting tools?
A: Power BI offers several advantages over the default reporting tools in Dynamics 365. It provides advanced analytics capabilities, intuitive visualizations, and enhanced interactive reporting features. Users can create complex dashboards that provide real-time insights and drill-down functionalities that are often limited in traditional reporting tools. This allows stakeholders to engage with data in more meaningful ways, driving better decision-making.
Q: What resources are available for users looking to get started with Power BI for Dynamics 365?
A: Microsoft offers comprehensive resources, including tutorials, documentation, and user forums, to assist individuals in learning how to create Power BI reports. Online platforms like YouTube have numerous walkthrough videos, while organizations can also access official training programs. Additionally, community forums can provide peer support and best practices for overcoming common challenges.
Q: What is the future of Power BI integration with Dynamics 365?
A: The future appears promising, with Microsoft consistently enhancing both Power BI and Dynamics 365 functionalities. As businesses increasingly rely on data-driven strategies, we can expect further integration improvements that allow for seamless data sharing, advanced analytics capabilities, and AI-driven insights. This evolution will inevitably empower organizations to leverage their data assets even more effectively, positioning them for competitive advantages in their respective markets.
In Conclusion
harnessing the capabilities of Power BI to create impactful reports for Dynamics 365 can significantly elevate the strategic decision-making processes within an organization. By integrating intuitive data visuals and analytical insights, businesses can unlock the full potential of their customer relationship and enterprise resource planning systems. As organizations continue to seek ways to improve their operations and gain a competitive edge, mastering the art of report creation in Power BI will prove invaluable. With ongoing advancements in data analytics and visualization tools, those who commit to refining their skills in this area will not only enhance their reporting capabilities but also drive meaningful change in their respective fields. The future of data-driven decision-making is bright, and Power BI stands at the forefront of this evolution, promising to empower users with the information they need to succeed.


