research report guide
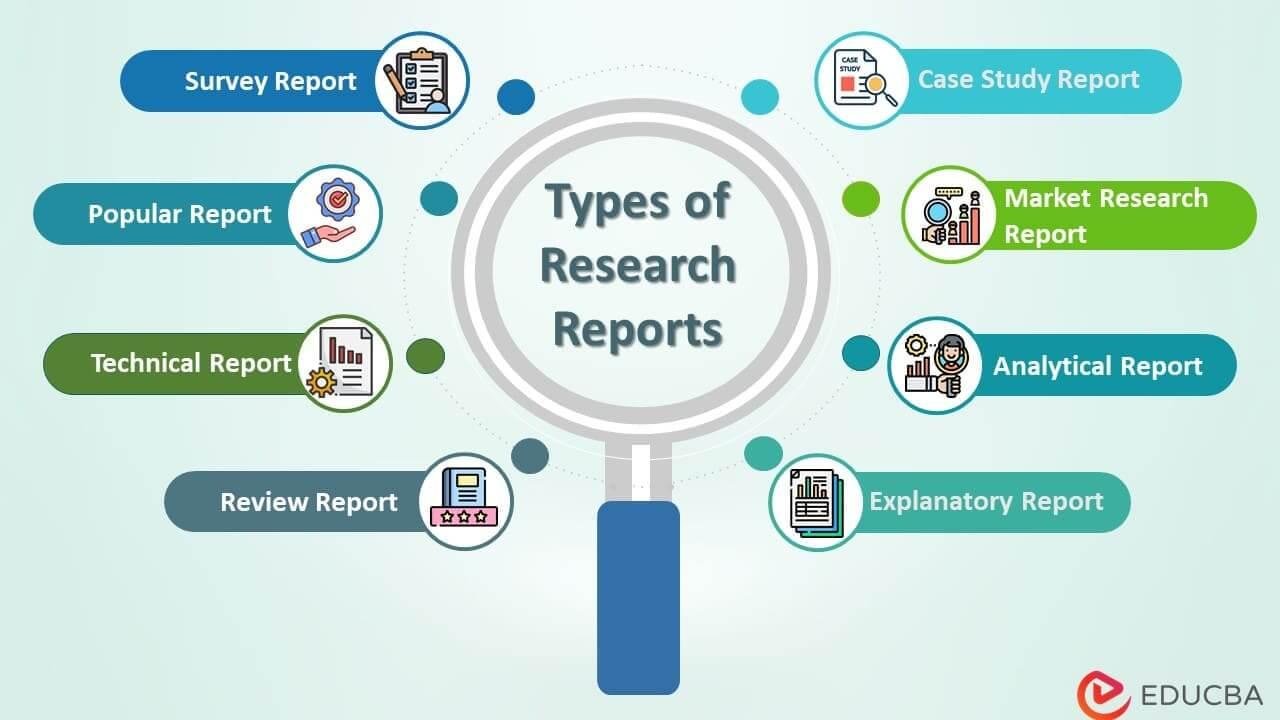
In the realm of academic inquiry, research reports stand as vital beacons of knowledge, illuminating the intricate paths of exploration and discovery. Whether you are delving into the sciences, engineering, or the social sciences, crafting a research report is an essential skill that encapsulates the rigor and clarity of your investigation. This guide aims to unravel the essential elements and structure of an effective research report, transforming complex data and findings into a coherent narrative that speaks to both seasoned scholars and curious minds alike. From articulating your research question to presenting your findings with precision, we will navigate the critical stages of report writing, ensuring your scientific journey culminates in a document that reflects the depth and significance of your work. Join us as we explore the foundational concepts and practical tips that will empower you to communicate your research with clarity and confidence.
Understanding the Essentials of a Research Report Framework
In crafting a compelling research report, it’s essential to adhere to a structured framework that guides the reader through your findings. The primary components include the Introduction, where you establish the research context and state your hypothesis; the Literature Review, which situates your work within existing research; the Methods section, detailing your research design, participants, and procedures; the Results, which present the data collected; and the Discussion, where you interpret your results and discuss their implications. Organizing your report around these key elements not only enhances clarity but also aids in maintaining the reader’s engagement throughout your study.
Each section of your report contributes a unique layer to the narrative of your research. For instance, the Methods section should be meticulous, providing enough detail for replication, while the Discussion serves as a platform for critical analysis and contextualization of your findings. To further aid in understanding, consider using tables to succinctly present complex data. Here’s a sample table structure that might be employed in the Results section:
| Variable | Mean | Standard Deviation |
|---|---|---|
| Group A | 23.5 | 4.2 |
| Group B | 27.1 | 3.8 |

Crafting a Compelling Narrative: Tips for Effective Writing
html
To create an engaging narrative, start by establishing a strong foundation with your characters and setting. Think about the key elements that bring your story to life. Consider the following:
- Character Development: Make your characters relatable by giving them unique traits, backgrounds, and motivations.
- Setting Description: Use vivid imagery to paint a picture in the reader's mind, allowing them to fully immerse in the environment.
- Conflict: Introduce challenges and obstacles that drive the plot forward, keeping readers invested in the outcome.
Moreover, ensure your narrative flows smoothly by using transitional phrases and maintaining a consistent tone. A well-structured narrative often follows this pattern:
Structure Element
Description
Introduction
Set the stage and introduce main characters.
Rising Action
Build up to the main conflict.
Climax
The turning point of the story.
Falling Action
Consequences of the climax unfold.
Conclusion
Wrap up the narrative with resolutions.

Transforming Data into Insights: Strategies for Analysis and Presentation
To effectively transform raw data into actionable insights, analysts must implement various strategies that encompass cleaning, transforming, and visualizing the data. A foundational step is data cleaning, which ensures that inaccuracies and inconsistencies are addressed. Following this, data transformation allows analysts to reshape the data into a suitable format for analysis. This may involve techniques such as normalization, feature selection, and aggregation. Once the data is prepared, employing statistical methods and data modeling can help uncover hidden patterns and relationships. Tools such as Excel, R, or Python can facilitate these techniques, enabling analysts to derive significant conclusions from seemingly chaotic datasets.
Presentation is equally critical in conveying insights derived from data analysis. Visual representations, such as charts, graphs, and infographics, can make complex data more digestible for the audience. It’s important to select the right type of visualization based on the data being presented. For instance, line charts are ideal for displaying trends over time, while bar charts can be utilized for comparing quantities across different categories. Consider using interactive dashboards or reports that allow users to explore the data themselves. By applying best practices in both analysis and presentation, organizations can ensure that insights are not only accurate but also effectively communicated to support decision-making.
Navigating the Review Process: Best Practices for Feedback and Revisions
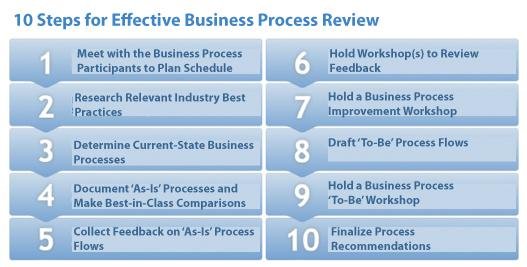
Receiving feedback on your research report can be a transformative experience, offering insights that enhance the clarity and impact of your work. To make the most of this process, it’s essential to approach feedback with an open mind. Begin by distilling key points from reviewer comments, identifying both strengths and weaknesses in your report. Consider creating a feedback summary table to organize the input efficiently, which will allow you to see overarching themes and prioritize revisions. Here’s a simple example:
| Feedback Area | Reviewer Comments | Action Required |
|---|---|---|
| Introduction | Needs clearer objectives. | Revise wording for clarity. |
| Methodology | More detail needed on sample size. | Add specific numbers. |
| Conclusion | Strengthen implications. | Expand on significance. |
After summarizing the feedback, develop a robust strategy for implementing revisions. Set forth by creating a revision plan that outlines the specific changes you will make, along with deadlines for each section. Collaborate with your co-authors or peers, as this can provide additional perspectives that refine your work further. Remember to keep track of your revisions to see how feedback has influenced your thought process. A well-structured approach to the review process not only demonstrates your commitment to quality research but also fosters a collaborative spirit that enhances the overall outcome.
In Summary
As we conclude this guide on research reports, it’s clear that mastering this essential document is vital for effectively communicating your findings and advancing your academic or professional pursuits. A well-structured research report not only showcases your hard work and dedication but also serves as a valuable resource for others in your field. Remember, the key components—introduction, literature review, methods, results, and discussion—are more than just sections; they are threads that weave your narrative into a cohesive and compelling story.
As you embark on your reporting journey, keep in mind the necessity of clarity, precision, and a critical eye. Each report is a unique reflection of your investigation, and with the guidance provided here, you are well-equipped to articulate your insights. So, take a deep breath, embrace the process, and let your research shine through the pages of your report. Happy writing!

